|
From the WSGR Database: Financing Trends for Q1 2018
For purposes of the statistics and
charts in this report, our database
includes venture financing
transactions in which Wilson
Sonsini Goodrich & Rosati
represented either the company or
one or more of the investors.
|
While venture financing valuations and deal
sizes were down in the first quarter of 2018
from the record-breaking levels of 2017,
they remained high by historical standards.
In Q1 2018, the percentage of up rounds
for Series B and later financings declined,
and median pre-money valuations and
amounts raised in Series B and later
financings fell moderately. However, in Q1
early-stage financings, there were slight
increases in median pre-money valuation
and amount raised. Notably, and consistent
with what has been reported elsewhere,
deal counts continued to decline in Q1
2018, following a trend toward a fewer
number of deals, even as the deal amounts
are on average larger.
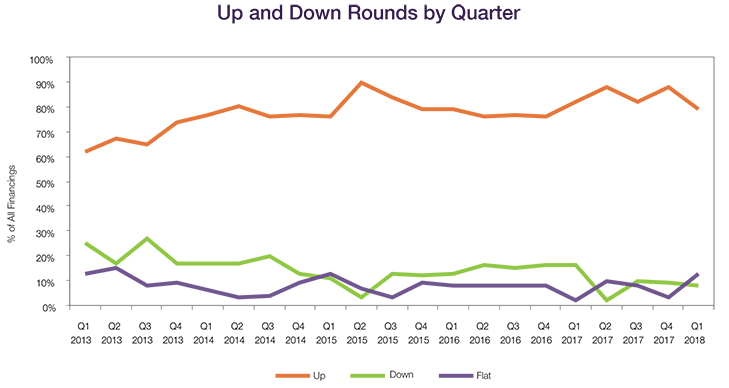
Up and Down Rounds
Up rounds fell as a percentage of all deals
in Q1 2018, constituting 79% of Series
B and later financings versus 88% in Q4
2017. Down rounds represented 8%
of financings in Q1 2018, down slightly
from 9% in Q4 2017. Flat rounds were
somewhat more prevalent in Q1 2018 as
compared to recent quarters, constituting
13% of Q1 2018 financings.
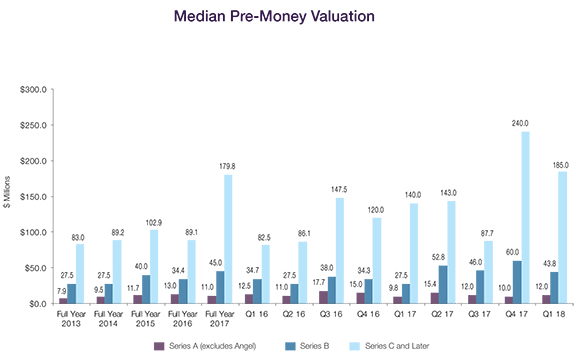 Valuations
Early-stage valuations ticked up slightly
in Q1 2018, with the median pre-money
valuation for Seed and Series A financings
increasing to $12.0 million from $10.0
million in Q4 2017. That increase was
not mirrored in the median pre-money
valuations for later rounds. The median
pre-money valuation for Series B rounds
decreased to $43.8 million in Q1 2018
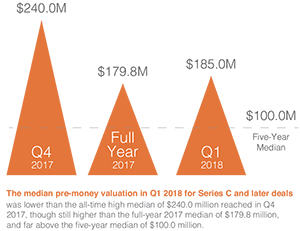
from $60.0 million in Q4 2017. Similarly, the
$185.0 million pre-money valuation in Q1
2018 for Series C and later deals was lower
than the all-time high median of $240.0
million reached in Q4 2017, though still
higher than the full-year 2017 median of
$179.8 million, and far above the five-year
median of $100.0 million.
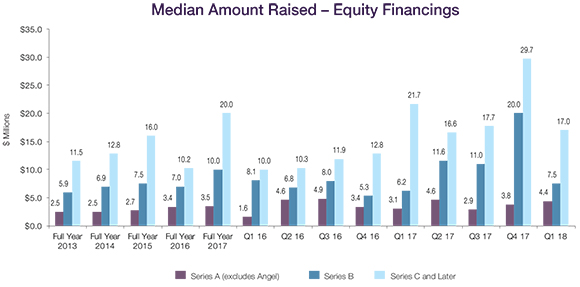
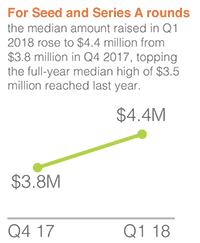 Amounts Raised Amounts Raised
For Seed and Series A rounds, the median
amount raised in Q1 2018 rose to $4.4
million from $3.8 million in Q4 2017,
topping the full-year median high of $3.5
million reached last year. The median
amount raised in Series B financings in Q1
2018 fell to $7.5 million from the all-time
high of $20.0 million reached in Q4 2017.
The median amount raised in Series C
and later financings likewise retreated from
Q4 2017s historic high of $29.7 million to
$17.0 million in Q1 2018, but remained
above the five-year median of $14.6 million.
Deal Terms - Preferred
Senior liquidation preferences in post-Series A rounds were less common in Q1 2018, decreasing from 35% of all such rounds in 2017 to 28% in Q1 2018, the lowest percentage seen in the past five years. Pari passu liquidation preferences increased to 72% of post-Series A rounds in Q1 2018 from 62% in 2017, the highest percentage seen in the past five years.
The percentage of financings having a liquidation preference with participation dipped slightly in Q1 2018, to 14% from 16% of financings in 2017 and 20% in 2016.
 Fewer financings provided dividends in Q1 2018 than in prior years, with 73% offering dividends, as compared to 85% of financings in 2017. The use of redemption rights decreased as well, accounting for just 3% of Q1 2018 financings, down from 19% in 2017. The significant drop in the number of deals with redemption rights reflects the continuing leverage that companies have to dictate terms in a strong market. Fewer financings provided dividends in Q1 2018 than in prior years, with 73% offering dividends, as compared to 85% of financings in 2017. The use of redemption rights decreased as well, accounting for just 3% of Q1 2018 financings, down from 19% in 2017. The significant drop in the number of deals with redemption rights reflects the continuing leverage that companies have to dictate terms in a strong market.
Data on deal terms such as liquidation preferences, dividends, and others are set forth in the table below. To see how the terms tracked in the table can be used in the context of a financing, we encourage you to draft a term sheet using our automated Term Sheet Generator, which is available in the Start-Ups and Venture Capital section of the firm's website at www.wsgr.com.
Private Company Financing Deal Terms (WSGR Deals)1
|
2013 |
2014 |
2015 |
2016 |
2017 |
Q1 2018 |
2013 |
2014 |
2015 |
2016 |
2017 |
Q1 2018 |
2013 |
2014 |
2015 |
2016 |
2017 |
Q1 2018 |
All Rounds2 |
All Rounds2 |
All Rounds2 |
All Rounds2 |
All Rounds2 |
All Rounds2 |
Up Rounds3 |
Up Rounds3 |
Up Rounds3 |
Up Rounds3 |
Up Rounds3 |
Up Rounds3 |
Down Rounds3 |
Down Rounds3 |
Down Rounds3 |
Down Rounds3 |
Down Rounds3 |
Down Rounds4 |
Liquidation Preferences - Series B and Later |
Senior |
41% |
40% |
33% |
38% |
35% |
28% |
38% |
32% |
31% |
36% |
31% |
32% |
47% |
68% |
35% |
41% |
63% |
N/A |
Pari Passu with Other Preferred |
55% |
56% |
62% |
57% |
62% |
72% |
60% |
64% |
66% |
62% |
66% |
68% |
37% |
21% |
53% |
45% |
38% |
N/A |
Junior |
0% |
0% |
1% |
1% |
0% |
0% |
0% |
0% |
1% |
0% |
0% |
0% |
0% |
0% |
0% |
5% |
0% |
N/A |
Complex |
3% |
2% |
3% |
4% |
3% |
0% |
2% |
2% |
1% |
2% |
4% |
0% |
11% |
5% |
12% |
9% |
0% |
N/A |
Not Applicable |
1% |
3% |
1% |
0% |
0% |
3% |
0% |
2% |
1% |
0% |
0% |
0% |
5% |
5% |
0% |
0% |
0% |
N/A |
Participating vs. Non-participating |
Participating - Cap |
18% |
12% |
8% |
9% |
6% |
3% |
20% |
14% |
11% |
10% |
7% |
5% |
23% |
13% |
12% |
22% |
31% |
N/A |
Participating - No Cap |
12% |
14% |
11% |
11% |
10% |
11% |
10% |
11% |
12% |
13% |
11% |
11% |
30% |
32% |
35% |
4% |
19% |
N/A |
Non-participating |
70% |
74% |
81% |
81% |
84% |
85% |
69% |
76% |
77% |
77% |
82% |
84% |
48% |
55% |
53% |
74% |
50% |
N/A |
Dividends |
Yes, Cumulative |
12% |
13% |
3% |
6% |
7% |
10% |
12% |
11% |
3% |
7% |
9% |
11% |
13% |
24% |
24% |
22% |
13% |
N/A |
Yes, Non-cumulative |
74% |
72% |
82% |
73% |
78% |
63% |
79% |
74% |
86% |
78% |
78% |
74% |
79% |
71% |
76% |
70% |
81% |
N/A |
None |
14% |
15% |
15% |
21% |
16% |
27% |
9% |
15% |
11% |
15% |
13% |
16% |
8% |
5% |
0% |
9% |
6% |
N/A |
Anti-dilution Provisions |
Weighted Average - Broad |
90% |
85% |
80% |
92% |
94% |
88% |
94% |
90% |
86% |
92% |
96% |
95% |
95% |
92% |
75% |
91% |
100% |
N/A |
Weighted Average - Narrow |
3% |
9% |
13% |
1% |
2% |
3% |
3% |
6% |
12% |
1% |
1% |
5% |
0% |
5% |
19% |
0% |
0% |
N/A |
Ratchet |
1% |
1% |
1% |
1% |
0% |
0% |
0% |
1% |
1% |
2% |
0% |
0% |
3% |
0% |
0% |
0% |
0% |
N/A |
Other (Including Blend) |
1% |
1% |
1% |
3% |
1% |
2% |
1% |
1% |
1% |
3% |
1% |
0% |
0% |
0% |
0% |
9% |
0% |
N/A |
None |
5% |
4% |
5% |
3% |
3% |
8% |
2% |
2% |
1% |
2% |
1% |
0% |
3% |
3% |
6% |
0% |
0% |
N/A |
Pay to Play - Series B and Later |
Applicable to This Financing |
5% |
4% |
5% |
5% |
2% |
4% |
1% |
1% |
3% |
3% |
2% |
0% |
15% |
16% |
18% |
9% |
6% |
N/A |
Applicable to Future Financings |
1% |
0% |
1% |
1% |
0% |
0% |
1% |
0% |
0% |
1% |
0% |
0% |
0% |
0% |
12% |
0% |
0% |
N/A |
None |
95% |
96% |
94% |
94% |
98% |
96% |
98% |
99% |
97% |
96% |
98% |
100% |
85% |
84% |
71% |
91% |
94% |
N/A |
Redemption |
Investor Option |
19% |
17% |
13% |
11% |
12% |
3% |
20% |
22% |
19% |
20% |
19% |
5% |
33% |
24% |
12% |
9% |
20% |
N/A |
Mandatory |
1% |
3% |
2% |
2% |
7% |
0% |
2% |
3% |
3% |
3% |
9% |
0% |
0% |
3% |
0% |
0% |
0% |
N/A |
None |
80% |
80% |
85% |
87% |
81% |
97% |
78% |
75% |
78% |
77% |
72% |
95% |
67% |
74% |
88% |
91% |
80% |
N/A |
| 1 We based this analysis on deals having an initial closing in the period to ensure that the data clearly reflects current trends. Please note the numbers do not always add up to 100% due to rounding. |
| 2 Includes flat rounds and, unless otherwise indicated, Series A rounds. |
| 3 Note that the All Rounds metrics include flat rounds and, in certain cases Series A financings as well. Consequently, metrics in the All Rounds column may be outside the ranges bounded by the Up Rounds and Down Rounds columns, which will not include such transactions. |
| 4 Due to the small number of down rounds in Q1 2018, we did not calculate the deal term percentages in this category. |
| |
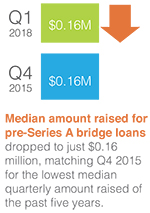
Bridge Loans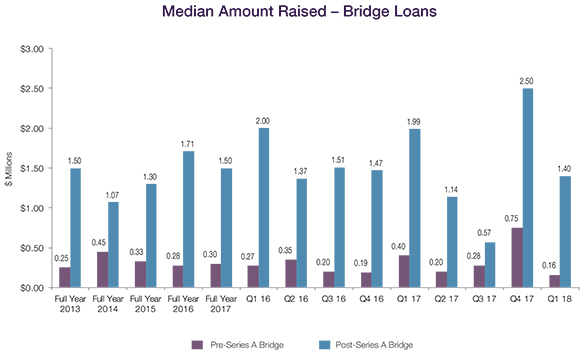
The median amounts raised for bridge loans fell sharply for both pre- and post-Series A deals in Q1 2018. The median amount raised for pre-Series A bridge loans dropped to just $0.16 million, matching Q4 2015 for the lowest median quarterly amount raised of the past five years. Post-Series A bridges also raised fewer dollars, with the median amount raised declining to $1.40 million, far lower than the $2.50 million median of Q4 2017, though still close to the full-year 2017 median of $1.50 million.
 Deal Terms – Bridge Loans Deal Terms – Bridge Loans
Bridge loan interest rates rose in Q1 2018, with 50% of both pre- and post-Series A bridge loans having interest rates of 8% or greater a significant increase from the corresponding 25% and 44% figures in 2017. Maturity periods increased significantly as well. Eighty-three percent of both pre-Series A and post-Series A bridge loans had maturity periods of more than 12 months in Q1 2018, up from 69% of pre-Series A loans and 41% of post-Series A loans in 2017. All Q1 bridge loans were convertible; 75% of pre-Series A loans and all post-Series A loans received a discount rate of 20% or more on conversion.
Bridge Loans Deal Terms (WSGR Deals)1
Bridge Loans |
2013
Pre-Series
A |
2014
Pre-Series
A |
2015
Pre-Series
A |
2016
Pre-Series
A |
2017
Pre-Series
A |
Q1 2018
Pre-Series
A |
2013
Post-Series
A |
2014
Post-Series
A |
2015
Post-Series
A |
2016
Post-Series
A |
2017
Post-Series
A |
Q1 2018
Post-Series
A |
Interest rate less than 8% |
70% |
72% |
74% |
76% |
75% |
50% |
46% |
43% |
54% |
52% |
56% |
50% |
Interest rate at 8% |
29% |
22% |
19% |
19% |
17% |
50% |
34% |
42% |
33% |
30% |
27% |
17% |
Interest rate greater than 8% |
1% |
6% |
7% |
5% |
8% |
0% |
20% |
15% |
13% |
17% |
17% |
33% |
Maturity less than 12 months |
3% |
12% |
17% |
17% |
22% |
0% |
29% |
24% |
34% |
29% |
41% |
17% |
Maturity at 12 months |
19% |
16% |
9% |
5% |
8% |
17% |
38% |
39% |
8% |
23% |
19% |
0% |
Maturity more than 12 months |
78% |
71% |
74% |
78% |
69% |
83% |
33% |
37% |
58% |
49% |
41% |
83% |
Debt is subordinated to other debt |
25% |
22% |
15% |
20% |
28% |
17% |
56% |
48% |
38% |
45% |
33% |
50% |
Loan includes warrants2 |
4% |
5% |
3% |
8% |
0% |
17% |
34% |
19% |
25% |
17% |
16% |
17% |
Warrant coverage less than 25% |
0% |
20% |
100% |
80% |
N/A |
0% |
50% |
69% |
47% |
23% |
43% |
0% |
Warrant coverage at 25% |
0% |
0% |
0% |
0% |
N/A |
0% |
12% |
0% |
7% |
15% |
14% |
0% |
Warrant coverage greater than 25% |
100% |
80% |
0% |
20% |
N/A |
100% |
38% |
31% |
47% |
62% |
43% |
100% |
Principal is convertible into equity3 |
100% |
98% |
93% |
97% |
97% |
100% |
94% |
94% |
86% |
92% |
92% |
100% |
Conversion rate subject to price cap4 |
68% |
67% |
64% |
79% |
74% |
67% |
14% |
23% |
26% |
29% |
34% |
17% |
Conversion to equity at discounted price5 |
91% |
81% |
78% |
82% |
89% |
67% |
59% |
73% |
71% |
74% |
76% |
83% |
Discount on conversion less than 20% |
17% |
10% |
11% |
12% |
16% |
25% |
16% |
25% |
25% |
25% |
20% |
0% |
Discount on conversion at 20% |
60% |
72% |
73% |
76% |
74% |
50% |
46% |
44% |
47% |
49% |
50% |
80% |
Discount on conversion greater than 20% |
22% |
17% |
16% |
12% |
10% |
25% |
38% |
32% |
27% |
26% |
30% |
20% |
Conversion to equity at same price as other investors |
9% |
16% |
18% |
13% |
3% |
17% |
35% |
24% |
25% |
19% |
24% |
17% |
1 We based this analysis on deals having an initial closing in the period to ensure that the data clearly reflects current trends. Please note the numbers do not always add up to 100% due to rounding.
2 Of the 2013 post-Series A bridges with warrants, 24% also had a discount on conversion into equity. Of the 2014 post-Series A bridges with warrants, 38% also had a discount on conversion into equity. Of the 2015 post-Series A bridges with warrants, 58% also had a discount on conversion into equity. Of the 2016 post-Series A bridges with warrants, 33% also had a discount on conversion into equity. Of the 2017 post-Series A bridges with warrants, 60% also had a discount on conversion into equity. Due to the small number of post-Series A bridges with warrants in Q1 2018, we did not do the comparision
3 Of the 2016 pre-Series A convertible bridges, 93% had automatic conversion and 7% had voluntary conversion. Of the 2017 pre-Series A convertible bridges, 94% had automatic conversion and 6% had voluntary conversion. Of the Q1 2018 pre-Series A convertible bridges, 100% had automatic conversion and 0% had voluntary conversion. Of the 2016 post-Series A convertible bridges, 97% had automatic conversion and 3% had voluntary conversion. Of the 2017 post-Series A convertible bridges, 93% had automatic conversion and 7% had voluntary conversion. Of the Q1 2018 post-Series A convertible bridges, 83% had automatic conversion and 17% had voluntary conversion. The 2016 median dollar threshold for a qualified financing in pre- and post-Series A bridges was $1M and $5M, respectively. The 2017 median dollar threshold for a qualified financing in pre- and post-Series A bridges was $2M and $10M, respectively. The Q1 2018 median dollar threshold for a qualified financing in pre- and post-Series A bridges was $4M and $5M, respectively.
4 The 2016 median price cap in pre- and post-Series A bridges was $6M and $25M, respectively. The 2017 median price cap in pre- and post-Series A bridges was $10M and $25M, respectively.
5 Of the 2013 post-Series A bridges that had a discount on conversion into equity, 15% also had warrants. Of the 2014 post-Series A bridges that had a discount on conversion into equity, 10% also had warrants. Of the 2015 post-Series A bridges that had a discount on conversion into equity, 21% also had warrants. Of the 2016 post-Series A bridges that had a discount on conversion into equity, 8% also had warrants. Of the 2017 post-Series A bridges that had a discount on conversion into equity, 13% also had warrants. Due to the small number of post-Series A bridges with warrants in Q1 2018, we did not do the conversion.
|
[back to top]
The View from Across the Pond: A Data-Driven Comparison of European and U.S. Venture Capital Transactions
By Daniel Glazer (Partner, New York)

|
1. U.S. and European trends are broadly similar, but the changes are more pronounced in the U.S.
Over the past several years, the U.S. and European
venture capital markets have both seen increases
in deal sizes and a drop in the number of deals.
However, the changes in the European markets
have been much more subtle and the venture
capital market is still much smaller than in the U.S.
Venture capital funds in the U.S. have been able
to raise significantly larger amounts than European
funds—U.S. venture capital funds are, on average, three times larger than European venture capital funds. Furthermore, U.S. funds raise, on average, 60-70% of the global venture capital raised.
Meanwhile, later stage private equity funds and
crossover funds that traditionally invested only
in public companies have dramatically increased
their investments in late-stage private companies.
With more funds available than ever before in
both Europe and the U.S. for investment in private
technology companies, we expect these trends
to continue in both markets at least until there is a
significant correction in the broader capital markets.
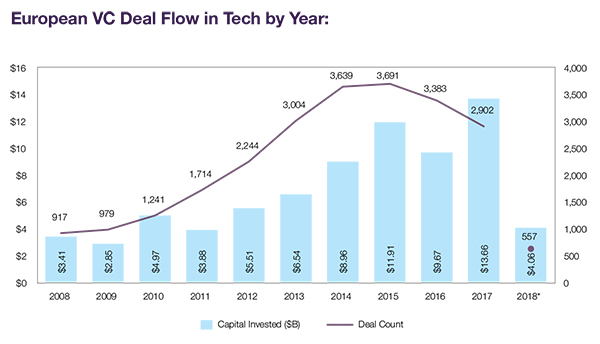
2. In Europe, there are fewer deals but more money overall than in prior years.
In 2017 there were 2,902 venture deals reported in
Europe, which was significantly down from a total
of 3,383 deals in 2016 and 3,691 deals in 2015.
However, the total amount invested increased significantly,
with $13.66 billion raised in 2017, up from
$9.67 billion in 2016 and $11.91 billion in 2015.
This trend of fewer, larger deals has become even
more pronounced in recent years, signaling a maturation
of the European venture finance ecosystem.
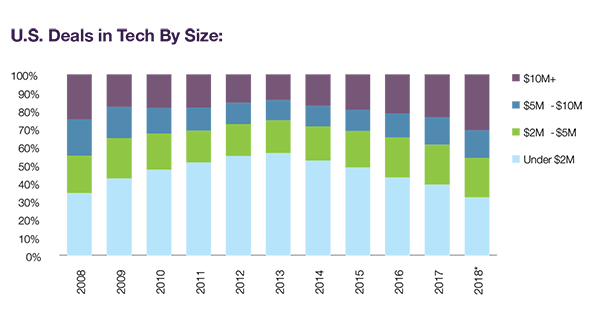
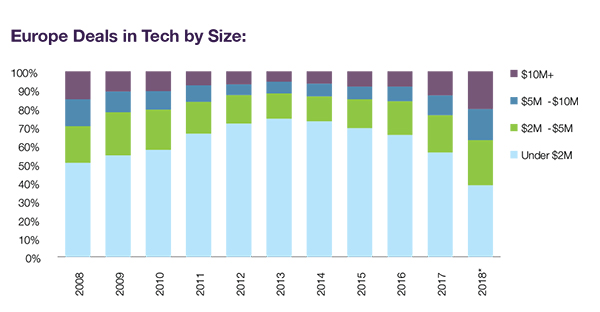
3. A larger percentage of European deals are smaller sized than in the U.S.
Fewer than 40% of U.S. venture capital deals raised under $2.0 million in 2017. In Europe, however, 56% of deals raised under
$2.0 million. Across both markets, the
percentage of smaller deals has been
decreasing, but the majority of European
venture capital deals remain relatively
early-stage.
4. There has been a stark increase in the number of large deals in Europe.
Across both markets, the percentage
of deals valued more than $10.0 million
has continued to increase over the last
several years, particularly in Europe.
These large deals comprised only 8%
of total deals in 2015 and 2016, but
the percentage jumped to almost 13%
of total deals in 2017 and 20% in the
first quarter of 2018. There also has
been an increase in the number of deals
between $5.0 million to $10.0 million,
which made up 17% of the deals in the
first quarter of 2018 and 11% of deals in
2017, up from roughly 7% in 2015 and
2016. The U.S. market also has seen
a steady increase in the percentage of
large deals, but the increase has not
been as dramatic over the last year.
5. Average deal size and pre-money valuation are materially lower in Europe versus the U.S. This gap is even larger when compared solely with the West Coast of the U.S.
European deal sizes and pre-money
valuations are much lower than in the
U.S. In 2017, despite an increase in European
deal size, the average U.S. West
Coast deal was more than twice as large
as the average European deal at every
stage of investment. In 2017, median
deal sizes for early-stage transactions
were nearly three times as large in the
U.S. as compared to Europe and late-stage
deals in the U.S. were 1.4 times
the size of late-stage deals in Europe.
These differences also are apparent in
median pre-money valuations. In 2017,
U.S. pre-money valuations were 2.6
times higher for seed-stage deals, 4.2
times higher for early-stage deals, and
5.8 times higher for late-stage deals.
These multiples are even higher when
compared only against West Coast
deals, with multiples of 2.8 times, 4.9
times and 7.4 times, respectively.
|
[back to top]
Methodology
The Up/Down/Flat analysis is based on WSGR deals having an initial closing in the period reported to ensure that the data clearly reflects current trends. The median pre-money valuation is calculated based on the pre-money valuation given at the time of the initial closing of the round. If the issuer has a closing in a subsequent quarter, the original pre-money valuation is used in the calculation of the median for that quarter as well. A substantial percentage of deals have multiple closings that span fiscal quarters. The median amount raised is calculated based on the aggregate amount raised in the reported quarter. For purposes of this report, Series Seed transactions are included with Series A transactions.
This report is based on detailed deal data provided by the firms corporate and securities attorneys and analyzed by the firm's Knowledge Management department.
To learn more about WSGR's full suite of services for entrepreneurs and early-stage companies, please visit the Start-Ups and Venture Capital section of wsgr.com.
For more information about this report or if you wish to be included on the email subscription list, please email us at EntrepreneursReport@wsgr.com. There is no subscription fee. |
This communication is provided as a service to our clients and friends and is for informational purposes only. It is not intended to create an attorney-client relationship or constitute an advertisement, a solicitation, or professional advice as to any particular situation.
© 2018 Wilson Sonsini Goodrich & Rosati, Professional
Corporation
Click here for a printable version of The Entrepreneurs Report |