From the WSGR Database: Financing Trends for 2015
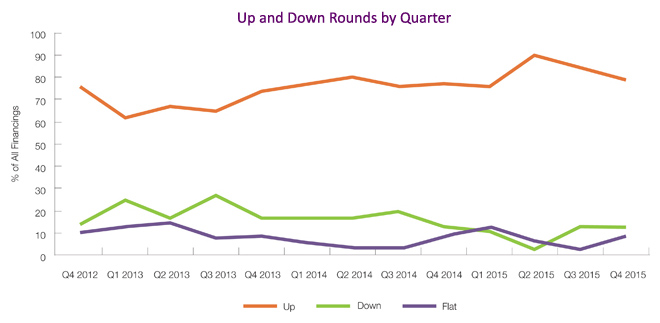
As reported in the financial press, 2015 saw a record total amount of money raised by venture-backed companies, with a smaller total number of deals than in recent years, reflecting substantial investments at high valuations. Although valuations and amounts raised in the fourth quarter of the year showed some softening, overall metrics for Q4 indicate a market that remained strong compared to prior years. Up and Down Rounds 2015 was a very good year for companies closing post-Series A rounds. Up rounds constituted 83% of all Series B and later financings for the year, peaking in Q2 at 90%. Although the percentage of up rounds declined thereafter, the percentage of up rounds finished at a strong 79% of all Q4 2015 post-Series A financings. The percentage of down rounds rose in the final two quarters of 2015, but remained lower than in recent years.
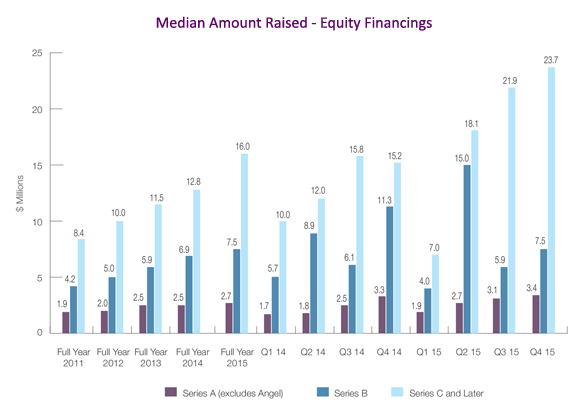
Amounts Raised Median amounts raised in closings in 2015 were also strong, higher than any year in the WSGR database since 2007. The median amount raised in 2015 was $2.7 million for Seed and Series A rounds, $7.5 million for Series B rounds, and $16.0 million for Series C and later rounds. Fourth-quarter median amounts raised exceeded the full-year amounts, at $3.4 million for Seed and Series A, $7.5 million for Series B, and $23.7 million for Series C and later. However, the average amount raised in Series C and later closings declined during the course of the year, from $41.1 million in Q2 2015 to $30.1 million in Q4 2015. This was a result of a smaller number of very large transactions, but is still indicative of a company-favorable market. Deal Terms - Preferred Deal terms continued to favor founders and early investors in 2015. The use of senior liquidation preferences fell to 33% of post-Series A rounds, continuing a decline that has persisted for several years. The use of senior liquidation preferences in down rounds also dropped markedly, from 68% percent in 2014 to 35% in 2015. The use of participating preferred stock continued to fall, from 26% of deals in 2014 to 19% of deals in 2015, a trend discussed more extensively in the Price and Preference articles in the 1H 2014 and Q1 2015 editions of The Entrepreneurs Report. Data on deal terms such as liquidation preferences, dividends, and others are set forth in the table below. To see how the terms tracked in the table can be used in the context of a financing, we encourage you to draft a term sheet using our automated Term Sheet Generator, which is available in the Start-Ups and Venture Capital section of the firms website at www.wsgr.com. Private Company Financing Trends (WSGR Deals)1
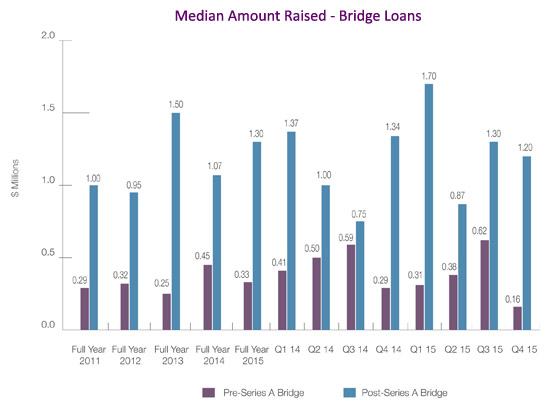
Bridge Loans The number of pre-Series A deals was sharply lower in Q4 than in prior quarters of 2015. This smaller data set may be the cause of an unusual decline in the median amount raised in pre-Series A bridge financings, from a high of $0.62 million in Q3 2015 to $0.16 million in Q4 2015. The median amount raised in post-Series A bridge financings also dropped, though by a relatively modest amount, from $1.3 million in Q3 2015 to $1.2 million in Q4 2015. Deal Terms for Bridge Loans Both interest rates and maturities remained company-favorable in 2015. There were significant decreases in warrant coverage for pre-Series A bridge loans, and modest increases for post-Series A bridge loans. Price caps for conversion to equity remained popular for pre-Series A loans, and discounts on conversion were favored for both pre- and post-Series A loans.
An Interview with Alex Niehenke from Scale Venture Partners Wilson Sonsini Goodrich & Rosati partner Donna Petkanics recently sat down with Alex Niehenke, principal at Scale Venture Partners. Among other topics, Alex discussed recent developments at Scale, his predictions for the SaaS market, his perspective on valuations, and the 2016 IPO market. Below is a selection of highlights from their discussion. Whats happening at Scale Venture Partners these days? Its an exciting time at Scale. Weve started the year off with a fifth fund, which is a $335 million fund. As we enter what looks to be a little bit of a tougher year, at least in the public markets, were eager to continue our investment pace. Weve already announced two deals. One is an investment in JFrog, a company in the infrastructure space. The other is an investment in Lever, a company in the recruiting software space. Thats two deal announcements, plus the fund announcement, all in January, so weve been busy. I know you personally do a lot of investing in software as a service. Why are you drawn to SaaS?
Do you see big disruptions within that market in the future? I recently posted an article on our blog about how SaaS continues to evolve and, on the application side, we are seeing a second generation of SaaS. In the first generation, the broad horizontal suites were largely solved. Salesforce.com dominates sales. NetSuite dominates finance. Workday dominates HR. In marketing, its either Salesforce or Adobe, depending on your organization. While I think there is a vibrant ecosystem of platforms that are filling in gaps, in those markets, those opportunities are becoming smaller. So at Scale, when we think about where the second generation of SaaS is going to be, broadly, I think its going to be in three categories. The first category is vertical software or vertical clouds within niche industries. From a total market view, these can still be massive sectors and companies are building software specific to these markets. One example might be management software for the agricultural market. Another is CRM software for the pharmaceutical sector, like Veeva, which had a very successful IPO. And theres also MINDBODY, which is a combination of CRM and scheduling software for health professionals, like training and fitness instructors. So, I think vertical software is an exciting area in the second decade of SaaS. The second category is the small and mid-size business (SMB) market. If you look at the companies that went public in the last 18 months, youll find a wave of companies selling at an average price thats often under $5,000, and most definitely under $10,000. I think about companies like Square, MINDBODY, and AppFolio in the real estate space. HubSpot has crept up to about $12,000 today, but they started inside the SMB market. Zendesk is a sub-$10,000 ASP. There are examples where the original platforms either started at the enterprise level and the companies never really built solutions for the low end of the market, or they started from the low end and moved up market quickly. The SaaS companies in this new crop thats emerging, some of which have reached scale, are delivering solutions for their particular SMB market. One reason for their success is that you can now reach users in a cost-effective way. Historically, that wasnt the case, but because of online and content marketing, the acquisition models have been flipped on their head, so many users today are taught not to talk to a salesperson anymore. I could become a DocuSign customer today without ever interacting with a DocuSign salesperson, which means a zero acquisition cost for them. The third category I like in SaaS is replacement of existing company spend with a software component. For example, our portfolio company RingCentral is replacing telephony cost with a software cost. Zenefits replaces healthcare spend with a software cost. Another one of our portfolio companies, Pantheon, puts a layer of software on top of your hosting costs and charges in bundle packages. Square takes your merchant processing and bundles that into a software package. So, I think companies are getting innovative about saying: Its hard to sell software to you, but you have this bucket of spend. We can replace that bucket of spend with a comparable solution, put a layer of software on top of it, and mark it up only marginally. Theres a lot of talk about a bubble and valuations. Do you think valuations are out of hand? Are entrepreneurs and investors going to be able to make money? I think its a case-by-case issue. Theres bifurcation in the market between the haves and have nots. In the current quarter, and in the last quarter, that bifurcation is increasing. There are category-defining companies being built. For instance, Uber has changed the way you use taxi cabs and thats happening in so many industries. There are wonderful companies being created. Of course, as some of those really wonderful companies are reaching skyrocket valuations, theres another set of companies that may still be quality companies (though not quite as great) that are using those valuation metrics to justify their own valuations. I think there was a phase, particularly in 2014 and maybe into 2015, where there was so much exuberance from the investor community, and while everybody complained about valuations, they would all keep doing the deals and competing with each other on price, and that pushed valuations to a place where more recently youve seen a level of calmness and the pace potentially slowing. Obviously, public markets have retreated a bit and private-market investors tend to be sensitive to that. So in terms of company valuations now, youd say they are leveling out? Its hard to say. With the start of a new year, thats a popular topic of conversation, but nobody has the data yet. Entrepreneurs are definitely coming into our offices and willing to have a more open conversation around valuation. They arent coming in and leading with a sky-high ceiling number, though we have seen some high-priced rounds still get done. Back to the note about bifurcation, the best companies that still have plenty of capital interested in them have very strong valuations. Well find out over the next quarter or two if valuations are going to hold steady, go down, or go up. When you have entrepreneurs coming in to pitch to you at Scale, do you recommend that they come in with a valuation or that they come in open to hearing about a valuation from you? We want them to come in and see if were the right fit for them. I think the industry does itself a disservice by focusing so much attention on valuation, and both venture capitalists and entrepreneurs are at fault for that. Ive never met an entrepreneur or a venture capitalist that has regretted in their success stories the valuations that they decided upon two, five, ten years ago. Nobody ever says, I wish the pre-money had been 10 percent higher or lower. People celebrate those successes. Ultimately, the entrepreneur has the responsibility to himself and his equity share—and, if hes a board member, to common and other shareholders—to maximize that value. As venture capitalists, we have a responsibility to our LPs to maximize our dollars. The best outcomes happen when entrepreneurs come in excited to learn about us and our business, and we really listen to their business and understand what they are doing. Wed rather develop a relationship that way and let the valuation be a natural part of that discussion and negotiation. Thats great insight. We see entrepreneurs too fixated on valuation and not fixated enough on whos going to add value, whos going to help build the company, how they are going to grow it from where they are now, and how somebodys going to have their back in terms of bringing in the right network and the right team, and being a partner. Its important for entrepreneurs to realize that if they end up succeeding and raising a round at an immense valuation, the partner who signed up for that transaction in all likelihood has an immense amount of pressure to make sure that the company performs relative to the price that he/she was willing to pay for that asset. That pressure starts with the individual. Then it falls to the partnership, and that partnership saying, We took a big leap of faith here. Hows that company performing? So, sometimes when you push the boundaries of that, you create a situation where the pressure is so high from your investors to perform that it actually becomes uncomfortable for everybody. Youve been investing for nearly a decade. How has investing changed between 2006 and 2016? Traffic has changed in the Bay Area. No doubt about it. I was in Palo Alto yesterday and Im here again today, but I dont think Ive been in Palo Alto in the prior three to six months. I remember as recently as 2010, I was in Palo Alto every week. The ecosystem has morphed in such a way that so much of the capital, professional services, and entrepreneurs have moved further up the peninsula or to San Francisco. Some of that is the shift away from semiconductors initially, and then clean tech, which was further down in Silicon Valley. Some of that just reflects peoples preferences. I dont have data to support it, but I think now there are fewer funds and a concentration of capital with a smaller set of funds that cover a broader set of stages. Thats a fascinating development. As an entrepreneur, that means there may be fewer sources of capital to go to, so entrepreneurs really need to build relationships and understand those investors. The venture business continues to evolve, too. A few years ago, you could get away with reading whatever TechCrunch came out with, and if something made the headlines and you called the company, you were probably ahead of the curve. That doesnt work anymore. The speed of information has changed. The systems that venture capitalists are using to identify companies are pretty impressive. I remember implementing Salesforce six or seven years ago, and while a few other venture firms had implementations, I couldnt find anyone actually using it at the time, which I thought was stunning. To be a venture capital firm today and not use a CRM system is unheard of. Theres a lot more talk about marketing automation and leveraging that. Many venture firms are starting to realize that you can use third-party data sources to identify opportunities. I think the venture industry is a lot like any other industry thats changed and evolved through the introduction of technology. Hopefully that makes us better investors and benefits the entrepreneurs. How do you source your investments? We believe disruptions at the highest level start with large trends or even multiple trends, like the lower cost of computing or the move to the cloud. We talked about the second decade of SaaS. Right now we are spending a lot of time in a trend called automation by algorithm, which is the introduction of machine learning and artificial intelligence into broad-based software applications. We start by identifying these large trends—these multi-year events—that are not just going to impact one market, but are going to impact multiple markets. From there, we try to identify markets that are going to have the most impact. Sometimes a specific market is impacted by multiple trends. We then take it a step further and try to understand the winning companies within that market. I think thats where the use of those systems and resources comes in handy, because it helps us in the identification, evaulation, and monitoring of those companies. In the end, it still comes down to hand-to-hand combat—meeting with companies, spending time with entrepreneurs, making sure that they understand our business and we understand theirs, building a relationship, and hopefully putting together a set of data points that help us understand within a certain market where the most compelling opportunity is. We have found again and again that when we understand the trend, look at the markets, and pick the right company in a market, it creates really significant outcomes for us. Scale invests across all growth stages, but do you start out at the earliest stages? A lot of our clients are no longer going to traditional VCs. Its one of the most exciting developments. Around 2011 or 2012, I had several friends who had seed funds that were $10, $20, or $30 million vehicles. Those friends are all now managing over $100 million, and in some cases, $200-300 million worth of capital. Theyve become the next generation of Series A investors. Its been very fortunate for people in the ecosystem. I think about the team over at Felicis Ventures and Jeff Clavier over at SoftTech VC, and its been wonderful to see them develop. For us, our focus starts with that first customer. We look for product market fit (and we do think that having customers is a requirement in this regard). Then we look for companies that have a repeatability in their sales and marketing process. You mentioned our success in SaaS. Part of that is because once a company achieves product market fit, over 50 percent of it is op-ex spend, and therefore over 50 percent of it is burn; its going to go to sales and marketing spend, your go-to market. So thats where our venture dollars are going. We have a lot of expertise in that area. Thats why companies come to us. Well work with them throughout the process. It can be that first customer to $1 million in ARR, $10 million in ARR. And weve done deals all the way up to $50 or $70 million in ARR. But I would say in the current environment, were probably spending 70 to 80 percent of our time in the $0 to $10 million area. Where do you see the IPO market heading? We finished 2015 on a very strong note in the SaaS and B2B sector with the IPO of Atlassian, which is a fantastic company. That goes to show that great companies, even in a tough environment, can access the public markets. That company continues to be valued at a very healthy multiple, so there are positives for companies to be publicly listed. As I look at 2016, I think were going to see a few IPOs. It will probably be at a slower pace. Sooner or later, were probably going to see another consumer bellwether get pushed into the public markets. There is a healthy backlog of really high-quality SaaS companies that are at very good scale. Even if we get a very small window, we could see four to six companies get pushed out quickly. While Im not bullish on the IPO market for 2016 as a whole, were going to see some successful companies enter the public market. And, as always, were going to see a couple of cruddy deals get pushed out because people dont have options. Compared to when the market dropped in 2007-2008, we have higher quality companies now that actually have real revenue and real trends that are predictable. Thats one of the benefits in terms of SaaS. Its such a predictable model. Companies can go public and they can predict what their earnings are going to be, what their income is going to be. They can beat and exceed the market, which is what the bankers want when they go out. Predictability is incredibly appealing to the public markets. One of the things the world is coming to terms with (very, very slowly), particularly in the private markets, is that as SaaS matures as a category, and as we talk about vertical markets and focus on SMB, this new wave of companies that is emerging—because were limiting the market size, either by vertical or by SMB—naturally is going to have somewhat of a smaller market and therefore the acquisition costs are probably also going to be slightly higher. That means a lower sales efficiency, or to put it another way, growth is more expensive to achieve. A side effect of that is some of the early benchmarks around what the valuation multiples of a SaaS company should be are slowly coming down. In the public markets, youre seeing a more sane valuation multiple being put on the median SaaS company. Thats just an evolution and maturation of the ecosystem. The brightest and largest stars usually tend to be the first to come out. Were 15 years into this trend. Other stuff coming out now is going to be good, but its not going to have quite the same greatness, because there is no more opportunity to create the cloud sales software solution for every sales professional in the U.S. and worldwide. That market has been taken by Salesforce. You can create the best sales and marketing solution for attorneys now, for example, but thats a subset of the market and the valuation should reflect that. Thats the SMB market we talked about, and its just a tough market to enter because of the lower average sales prices, as you mentioned, and the ability to market to SMBs and get them to adapt. To put it differently, if you sell to somebody for $1,000 per year or $3,000 per year, thats only a $2,000 difference, but it also means 200 percent more room to cover your acquisition costs. One nuance that is often lost in the SMB sector is to understand the slight variances in how big the organizations are that are purchasing your software. How many of those are there? For example, a statistic that is mentioned a lot is that there are 29 million businesses in the U.S. When you dig deeper into that number, there are only approximately six million businesses in the U.S. that have more than one employee. The chances of selling something that costs more than $1,000 per year—and there are very few businesses that can sustain any sort of sales mechanism below that—into a one-person company are very low. So, understanding the demographic of users youre going after in your sales process is particularly compelling. You take a look at two recent IPO companies, Shopify and MINDBODY, and both make somewhere between 20 and 40 percent of their average sales price per customer from credit card processing for their customers. If youre a MINDBODY customer, you know software costs $50 a month, but MINDBODY will also handle the credit card transaction fees for you and they take a cut of that. Thats smart. There are big changes happening. There is a stunning statistic that two-thirds of buying decisions for software are being made these days before a salesperson touches the account. That has to do with inbound marketing, content marketing, and freemium business models. We just launched a new software system at Scale Venture Partners. We tried three different software vendors and never talked to a single salesperson. I actually met with a potential new client yesterday who is in her twenties and she said shes moving up here from Los Angeles because she wants to be able to meet people and talk to them in person. The companies that are doing it well in our portfolio are doing stunningly well. Inbound marketing as a concept—and maybe this is what Google has done to us—has brought us to the point where you can just spew out a boatload of content over a couple of years, and if theres awareness in the ecosystem, at some point the leads start showing up. HubSpot is obviously the creator of this as a concept. They get so many leads, tens of thousands per month. Its the silliest thing youve ever heard. Every time a music video gets big, theyll do, for instance, a Call Me Maybe HubSpot video, and youre thinking, That has nothing to do with marketing automation software, but if 50,000 people click on YouTube, then thats 50,000 people who heard it. It seems to work. Alex Niehenke has over a decade of experience in advising and investing in early and growth-stage software start-ups. At Scale Venture Partners, Alex focuses on opportunities in business software (marketing, sales, HR, finance) and vertical software (financial services, commerce, etc.). He has been involved with Scales investments in Bill.com, Demandbase, PeopleMatter, and Sailthru. Prior to joining Scale in 2013, Alex was at Crosslink Capital, where he worked on investments in Bleacher Report (acquired by Turner), Marin Software (MRIN), and Flurry (acquired by Yahoo). Prior to Crosslink, Alex was at investment bank Montgomery & Co., providing advisory services to Internet and software clients. Some of his clients included Club Penguin, MySpace, and LegalZoom. Alex can be reached at Alex@ScaleVP.com.
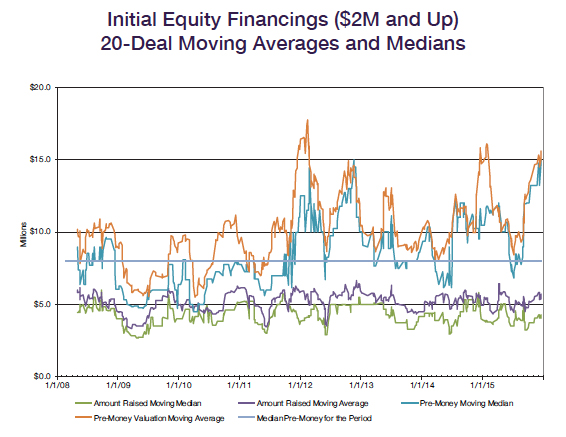
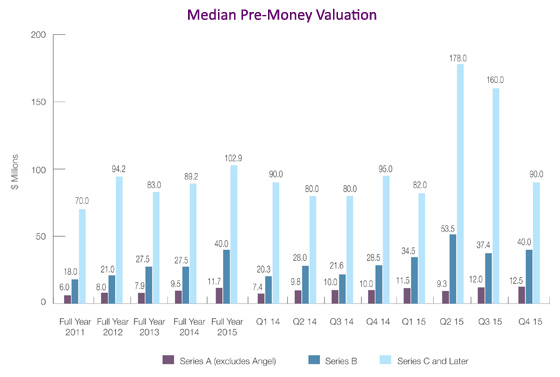
How Much Is My Company Worth? (2016 Edition) By Herb Fockler (Partner, Palo Alto) As discussed elsewhere in this report, company valuations rose in 2015 across financing rounds. We therefore thought it would be informative to update our prior discussions of pre-money valuations in initial equity round financings, which we last undertook in the Q3 2012 edition of The Entrepreneurs Report. At that time, we noted that while the median pre-money valuation for first equity rounds during 2008 through most of 2011 was mostly in the range of $5 million to $8 million, there had been a substantial and broad-based increase in late 2011 and 2012. We also speculated at the time that this then-recent increase was not just a temporary fluctuation, but rather a reflection of a longer-term change in valuations in general. Now, three-and-a-half years later, we can see that pre-money valuations have in fact remained at a higher level for almost the entire time since late 2011 compared to the years prior. Moreover, it now appears that our speculation in late 2012 was correct—structural developments in the market for start-up companies in late 2011 and 2012 have led to a stair-step increase in the price investors are willing to pay in the first equity investment round of a start-up company.1 In our updated analysis, we looked at all first equity round financings in which our firm was engaged through the end of 2015, and added to our previous data set all such financings that we deemed to be typical first equity rounds. The data set shows that the significantly higher median pre-money valuations we observed starting in late 2011 have generally continued since then. Prior to late 2011, median pre-money valuations had generally varied between $5 million and $8 million; in late 2011, median valuations increased dramatically and generally varied between $10 million and a somewhat incredible $14 million through early 2013. Moving into later 2013, median valuations, while still high by historical standards, moderated somewhat, ranging between $7 million and $10 million. This led to the question of whether the high median valuations from late 2011 to early 2013 were an aberration, with valuations regressing to earlier levels, or whether they were an indication of deeper changes in the market causing a permanently higher level of valuations, as discussed in our Q3 2012 article. Higher median valuations in the second half of 2014 led us to believe a year ago that the latter explanation might be correct, but the data set was fairly limited. Now, a year later, it appears more likely that a permanent change has taken place. Median valuations from mid-2014 through the end of 2015 generally returned to a range with a lower end of $10 million, although the higher end was now only $12 million, not the previous $14 million. At least, that is, until late 2015—in the last quarter of 2015, median valuations increased to an even more incredible $15 million. In other words, throughout that most recent quarter, 13 of the preceding 25 typical first equity round financings in which WSGR was involved had pre-money valuations of at least $15 million. Even more dramatic is the fact that the median pre-money valuation at year-end was a full three times that of just five years prior. Clearly, valuations are currently very founder friendly. To quote one venture capitalist about this period generally, Risk is not being adequately priced into financings.
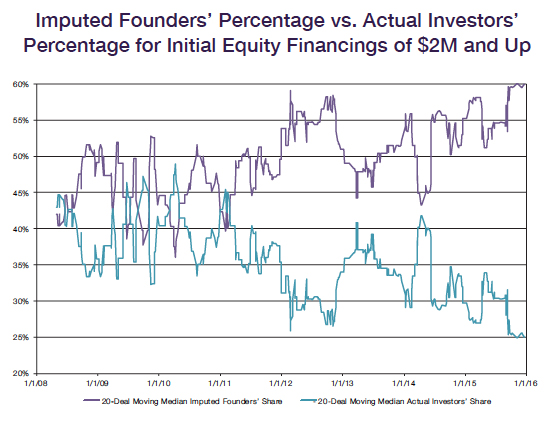
In contrast to this high volatility in median pre-money valuations, the median amount raised in first equity financings has remained remarkably consistent, generally between $3 million and $5 million. No similar stair-step change appears in late 2011, notwithstanding the dramatic increase in valuations. In fact, the median amount raised in 2015 for the most part remained between $3.5 and $5 million. The relationship between valuation and amount raised is not always clear. A lower valuation may reflect investors less optimistic views of the companys potential and/or its market, or it may be the result of the company being more in need of funds. The lower valuation may in turn push down the amount raised, as founders try to get by with as small a raise as possible at that valuation and hope for a better valuation later. Conversely, a high valuation may make investment funds appear cheaper to founders, who will then seek to raise more. However, to the extent these effects exist, they are too subtle to appear in our data. Combining the current high median valuations data with the current low amounts being raised demonstrates even more strongly the founder-favorable environment in recent years. As we did in the Q1 2013 article, we calculated a median imputed founders percentage and compared that to the actual percentage purchase by investors in the financing.2
The above chart of median imputed founders percentage plotted against actual investors percentage shows a similar significant change in late 2011 as seen in the median pre-money valuations. Prior to that time, the median imputed founders percentage and the median actual investors percentage varied back and forth, with the founders percentage ranging from somewhat below 40% to somewhat over 50%, with the high point occurring at the end of 2009 at 52.5% for the founders and 32.5% for the investors. Occasionally during this period, the ratio of the founders percentage was less than the investors percentage, with the low point occurring in the quarter following the high point at 49% for the investors and 36% for the founders. But the dominant characteristic of this period is its volatility, with the prevalence of one sides percentage over the other changing ten times in just three years. Since 2011, however, the lines do not cross. At no point since then has the median imputed founders percentage been less than the median actual investors percentage; the closest separation was 43% for the founders and 42% for the investors in April 2014. Moreover, despite some fairly wide swings, the spread between the founders and investors percentages has generally increased over time. The median imputed founders percentage grew steadily from 40% in early 2011 to around 58% at a couple of times during 2012. The spread then narrowed significantly in early 2013 and then again and for a longer period in early 2014. But that early 2014 narrowing, though pronounced in both size and length of time, now appears to have been just a temporary aberration. The imputed founders percentage shot up to 55% in mid-2014 and has since never gone below 50%. Most recently, the spread has expanded further, to the point where at the end of 2015 the median imputed founders percentage reached a surprising 60%, while the actual investors percentage declined to a corresponding 25%. Founders who in the last part of the last decade were worried about whether they would still have majority control of their company after the first equity financing now are well above that level, while investors currently appear to be willing to settle for fairly modest portions of companies in exchange for their first investments. In our experience, this very wide spread between founders and investors ownership levels after the first equity financing round is unprecedented.
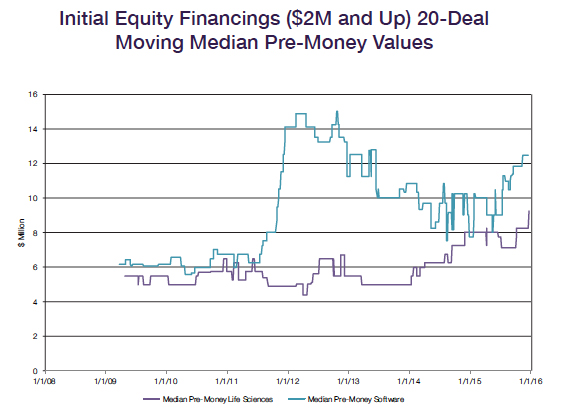
We also took a look at two specific industries—life sciences and software—to see whether the above trends held true in both. The data set indicates that they do not. Software exhibits much of the same stair-step increase in median pre-money valuations in late 2011. Life sciences, on the other hand, not only does not exhibit that increase, but the median valuation for the latter type of company actually goes down slightly in 2012. It is only in the past two years that median valuations for life sciences companies began to increase. This leads to the interesting implication that while the high pre-money valuations of 2012 and early 2013 were driven solely by information technology, the high valuations of late 2014 and 2015 are more broadly spread across industries. One additional point is that throughout the entire period examined, software companies have been continuously valued at higher levels than life sciences companies. Taken together, all these factors suggest that, although general market trends may be shared broadly across industries, absolute valuations still tend to reflect individual industry financing trends, factors, and needs. Methodology: Our attorneys are required to submit transaction summaries for all of the financings they work on. During the period discussed here, summaries were submitted for over 1,000 financings labeled either Seed or Series A. We selected from this group those transactions in which between $2 million and $20 million was raised and in which pre-money valuations were between $1 million and $50 million. From this group, we then excluded transactions that appeared to be preceded by a prior equity round, such as Series A transactions following one or more Seed rounds, or that for other reasons we judged not to be a typical first equity financing. The resulting data set contained nearly 600 financings.
1 For a discussion of what these developments might be, please see the articles in the Q3 2012 and Q1 2013 editions of The Entrepreneurs Report. We believe that the facts since then have shown our speculation on those developments to be correct, continuing through today.
This communication is provided as a service to our clients and friends and is for informational purposes only. It is not intended to create an attorney-client relationship or constitute an advertisement, a solicitation, or professional advice as to any particular situation. © 2016 Wilson Sonsini Goodrich & Rosati, Professional Corporation Click here for a printable version of The Entrepreneurs Report |
|||||||||||||||||||||||||||||||||||||||||||||||||||||||||||||||||||||||||||||||||||||||||||||||||||||||||||||||||||||||||||||||||||||||||||||||||||||||||||||||||||||||||||||||||||||||||||||||||||||||||||||||||||||||||||||||||||||||||||||||||||||||||||||||||||||||||||||||||||||||||||||||||||||||||||||||||||||||||||||||||||||||||||||||||||||||||||||||||||||||||||||||||||||||||||||||||||||||||||||||||||||||||||||||||||||||||||||||||||||||||||||||||||||||||||||||||||||||||||
 If you look at exits over $100 million during the last decade or on a 15- or 20-year basis, 70-75 percent of the exits are in technology, and about 25 percent are in healthcare. If you divide the 75 percent into B2B versus B2C companies, on a numbers basis, 70 percent of those exits are B2B companies. So, when you take a look at the industry and exits over $100 million dollars, roughly 60 percent are B2B companies. If you do that on a dollar basis, it skews a little toward consumer companies because of a few obvious names, like Google, Facebook, and Twitter. But based on frequency of exits, B2B software companies are where we think the most promising opportunities are from a market perspective. And as youre building a portfolio, you obviously want to invest in markets with the most opportunity and interest. Software as a service is the most common and most adopted business model in B2B software. We were very early in recognizing both the shift to the cloud and SaaS as a method and good market model. Weve been able to leverage our experience there, but it comes back to our focus on B2B software and our thinking as an investor that its the most compelling market.