
From the WSGR Database: Financing Trends for 2012
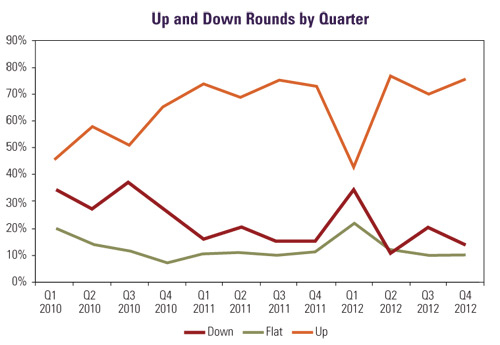
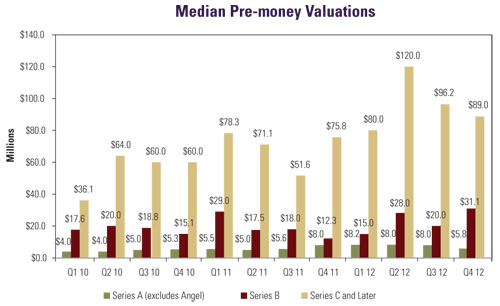
Total funds raised in venture deals in which Wilson Sonsini Goodrich & Rosati represented one of the principals declined slightly from 2011 to 2012. This decrease was consistent with the declines reported by industry-wide surveys such as PricewaterhouseCoopers' MoneyTree Report. On the positive side, the percentage of up rounds increased during Q4 2012 from the prior quarter. Also, while median pre-money valuations in Q4 declined somewhat from earlier in the year, they still remained higher than those in 2011 and 2010. Finally, preferred stock terms continued to be more company-favorable in 2012 than in prior years. For example, the percentage of deals with senior liquidation preferences was lower in 2012 than in 2011 and 2010, and the percentage of deals with non-participating preferred stock was higher in 2012 than in the two prior years. In sum, although total venture dollars raised in 2012 decreased from the previous year, the venture funding environment continues to be strong for entrepreneurs and early-stage companies.
Deal Terms Liquidation preferences. Senior liquidation preferences were used in 37% of all Series B and later deals in 2012, down from 47% of deals in 2011 and 50% in 2010. The use of such preferences decreased both in up rounds, from 34% of deals in 2011 to 30% in 2012, and in down rounds, from 79% of deals in 2011 to 56% in 2012. Conversely, pari passu liquidation preferences were used in 58% of 2012 Series B and later financings, up from 51% of 2011 deals and 48% of 2010 deals. The percentage increased both for up rounds (67% in 2012 versus 64% in 2011) and for down rounds (39% in 2012 versus 18% in 2011). These trends likely reflect the increasing valuations in later-stage rounds in 2012 as compared with 2011 and, thus, the corresponding greater negotiating power of earlier investors. Participation rights. The proportion of deals with non-participating preferred stock continued to increase in 2012 as compared with prior years, to 67% in 2012 from 58% in 2011 and 49% in 2010. The proportion increased both in up rounds, from 59% in 2011 to 67% in 2012, and in down rounds, from 32% in 2011 to 41% in 2012. The percentage of deals with capped participating preferred stock declined to 14% in 2012 from 16% in 2011, while the percentage with fully participating preferred stock decreased from 26% in 2011 to 19% in 2012. Again, these trends likely reflect the increasing valuations in later-stage rounds in 2012 as compared with 2011 and, thus, the corresponding greater negotiating power of companies and earlier investors. Anti-dilution provisions. Broad-based weighted-average anti-dilution protection provisions continued to be overwhelmingly prevalent, being used in 92% of 2012 deals, nearly identical to the 91% figure for each of 2011 and 2010. Broad-based weighted-average was used in 92% of 2012 up rounds, as compared with 91% of such rounds in 2011, and in 85% of 2012 down rounds, up from 80% in 2011. The use of full-ratchet anti-dilution stayed level at 3% of financings in 2012, the same as in 2011. Pay-to-play provisions. The use of pay-to-play provisions decreased from 12% of 2011 deals to 8% in 2012. Pay-to-play usage decreased both in up rounds, from 5% of 2011 financings to 4% of 2012 deals, and in down rounds, from 31% of 2011 financings to 26% of 2012 deals. Redemption. The use of redemption provisions dropped slightly, from 24% of deals in 2011 to 23% in 2012. Investor-option redemption (used in 22% of deals) continued to be far more popular than mandatory redemption (1%). To see how the terms tracked in the table below can be used in the context of a financing, we encourage you to draft a term sheet using our automated Term Sheet Generator. You'll find a link in the Entrepreneurial Services section of wsgr.com, along with information about the wide variety of services Wilson Sonsini Goodrich & Rosati offers to entrepreneurs and early-stage companies.
Private Company Financing Trends (WSGR Deals)1
Bridge Loans In Q3 2012, we began to report aggregate terms for convertible bridge loans. Q4 2012 saw some significant changes from Q1-Q3, with terms generally tightening for pre-Series A loans and loosening for post-Series A loans. Interest Rates. Interest rates for pre-Series A loans converged towards the 8% mark. Pre-Series A loans with a rate of exactly 8% increased from 31% of deals in Q1-Q3 2012 to 44% in Q4, while loans with rates above 8% fell from 6% of deals in Q1-Q3 2012 to zero in Q4, and loans with rates of less than 8% also declined substantially, from 63% of deals in Q1-Q3 2012 to 56% in Q4. Interest rates for post-Series A loans generally declined. Post-Series A loans with an interest rate of 8% fell from 49% of deals in Q1-Q3 2012 to 25% in Q4, while loans with rates under 8% increased from 36% of Q1-Q3 deals to 61% in Q4. Maturities. Maturities for pre-Series A loans shortened modestly. Pre-Series A loans with terms longer than one year decreased from 65% of Q1-Q3 2012 deals to 56% in Q4. By contrast, maturities for post-Series A loans converged on a term of exactly 12 months. Post-Series A loans with terms of exactly one year increased from 34% of Q1-Q3 2012 deals to 41% in Q4, and loans with shorter maturities declined from 39% of Q1-Q3 2012 deals to 33% in Q4. Subordinated Debt. The use of subordination increased for all loans. Subordinated pre-Series A loans increased from 6% of Q1-Q3 2012 deals to 31% in Q4; the corresponding increase for subordinated post-Series A loans was from 38% to 43%. Warrants and Conversion. The proportional use of warrants declined from Q1-Q3 2012 to Q4 for both pre-Series A loans (8% to 6%) and post-Series A loans (36% to 31%). In Q4 2012, 100% of pre-Series A deals with warrants set the coverage at 25%. The coverage amount was generally lower for post-Series A deals with warrants; the proportion of such deals with coverage below 25% increased from 39% in Q1-Q3 2012 to 63% in Q4 2012. Conversion. The use of a price cap on conversion increased in Q4, with a price cap specified in 88% of the Q4 pre-Series A loans (up from 52% in the period Q1-Q3 2012) and 29% of Q4 post-Series A loans (up from 18%). The proportion of loans featuring conversion into equity at a discounted price also increased. Discounts rose from 78% of pre-Series A loans in Q1-Q3 2012 to 88% in Q4; the corresponding increase for post-Series A loans was from 45% to 54%. The conversion discounts for post-Series A loans generally converged to 20%, with 79% of Q4 loans featuring this discount, up markedly from 32% in Q1-Q3. Multiples. Repayment of loans at a multiple in the event of an acquisition became much more popular for pre-Series A loans, increasing from 6% of such deals in Q1-Q3 2012 to 47% in Q4. The corresponding increase for post-Series A loans was more modest, from 20% to 25%.
The Tug of War between Founders and Investors Founders Seem to Be Winning By Herb Fockler, Partner (Palo Alto) In the last Entrepreneurs Report, we presented the results of a study we conducted looking at approximately 300 of the first-round equity financings in which our firm has been involved from January 1, 2008, through September 30, 2012. We started with a data set of approximately 700 total deals, including angel, seed, and traditional venture capital deals.1 We then screened these deals based on the amount invested ($2 million to $20 million) and the pre-money valuation ($1 million to $50 million), excluding deals that, for one reason or another, did not appear to be a typical first-round equity financing.2 (See "Pre-money Valuations Since 2008, or 'How Much Is My Company Worth?' Revisited," THE ENTREPRENEURS REPORT: Private Company Financing Trends, Q3, 2012.)
In our earlier article, we speculated as to some of the possible causes of the increase in valuations, including the "Instagram effect" pulling valuations higher; a founder-favorable climate fostered by former successful founders now turned super angels; and possibly an increase in the number of businesses started by second-time founders possessing the reputation to command higher valuations, as well as the personal wealth to fund their own ventures and perhaps a lower desire to seek traditional venture funding this time around. Each of the foregoing may have contributed to the recent valuation increase, but we believe the largest factor is simply that, as a result of incubators and accelerators and the proliferation of readily available tools to start and operate new ventures, entrepreneurs are able to stretch their resources for longer periods of time and concentrate on things that build company value. As a result, we believe that many new ventures are seeking their initial equity financing later than had been the case previously, both in terms of time and in terms of technology, product development, and achieved milestones for value creation. Since the last Entrepreneurs Report, we have considered how to expand our study to provide additional insights for entrepreneurs as they found new ventures. One area we will be pursuing is examining the impact the recent higher valuations may have on these companies when they seek to raise a second round of venture capital. On the one hand, the high early valuations may lead to a greater number of down Series B or later rounds. On the other hand, founders may feel that the early higher valuations have given them more available equity in their ventures with which to raise later-round capital. But any results of this examination will have to wait the 12 to 18 months that it normally takes for a company to work through its first-round investment.
The fall of 2010 through the end of 2011, on the other hand, was a founder-favorable time, with the median founder/investor split generally at, or just under, 45%/35% in favor of founders. Nonetheless, the fluctuations in the median split during the pre-2012 part of the period tended to balance themselves out. In fact, the median split for the period from the beginning of 2008 through the end of 2011 was exactly 40%/40%. The situation changed dramatically in 2012. The significant increase in pre-money valuations discussed above, coupled with the relatively constant amounts invested, resulted in a strong increase in the percentage that founders were able to retain in the companies through their first equity investment. Not only was the median founder/investor split for almost the entire year above 45%/35%, but it was at or above 50%/30% for much of the year and as high as 55%/25% for a couple of months in the fall. The increase was so strong that it pulled the median founder/investor split for the entire five-year period up from 40%/40% to 43%/37%. How long these atypically high founders' ownership percentages will continue is unclear. It seems remarkable that founders are able to negotiate 55%/25%/20% ownership splits among founders, investors, and option reserves, but the fact that the figures discussed here are medians over 25 deals means that in 12 of those 25 deals during periods in the fall of 2012, founders were able to retain more than 55% of their companies through their first financing. Truly, a very founder-favorable time. 1These financings are a subset of the Series A and seed financings (aggregated without regard to size) reviewed elsewhere in that issue and the current one. Option Pools: What's Market in the "New Normal" By Jim Brenner, Associate (Palo Alto) The use of options and other stock awards to attract key employees is a standard and important feature of entrepreneurial companies. In almost all cases, new investors require a company to increase the size of its option pool as part of the pre-money valuation prior to the financing, protecting the new investors from being diluted when the company subsequently issues equity compensation to new hires and existing employees. In effect, then, existing stockholders must suffer all of the dilution caused by the increase to the option pool prior to the closing of the new investment. As a result, a larger increase in the option pool effectively reduces the pre-money valuation of the company, so the negotiation of the option pool is an extension of the overall valuation negotiation. This situation can lead to a common question among founders as they negotiate for new investments: "How much stock should I set aside for my option pool?" The last time The Entrepreneurs Report conducted a survey of start-up company option pools to help answer this question was during the summer of 2008, a few months prior to the global economic downturn.1 The 2008 survey analyzed 95 companies immediately following their Series A financings, almost all of which were led by institutional venture capital investors (as distinguished from angel investors or strategic corporate investors). The results of the 2008 survey showed that a clear majority of these start-up companies established option pools in the range of 11% to 20% of the fully diluted capitalization of the companies. Given that the economy has changed significantly since the 2008 survey, we decided to update the data to answer some key questions:
Series A Financings The average size of the post-Series A total option pools that we examined was 15.9% of fully diluted capital and the median size was 14.5%. There was substantial deviation from the mean. The distribution of the total option pools after these financings is shown in the graph below.
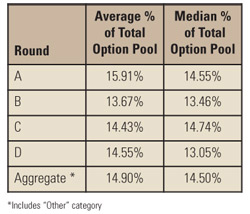
Size of the Total Option Pool The total option pool represents the proportion of the company that the founders and the other investors are willing to share with the company's employees and other service providers. The average size of a total option pool appears to remain fairly constant across companies as they mature. In our survey, both the average and median of the total option pools stayed within a couple of percentage points of each other for rounds A through D. Thus, as additional financings increase a company's capitalization, additional shares are allocated to the total option pool.
We also looked at the percentage of ungranted options still available following each round. During negotiations between founders (and existing investors) and new investors, this number is more important than the size of the total option pool. Two of the more important questions for the management team to ask themselves when negotiating the size of any option pool increase are: "Who will be expecting stock options?" and "How many options will I need to grant them?" The amount of ungranted options typically reflects the equity compensation that is expected to be required for employee growth and continued incentives between the time of the financing and the next round (12 to 18 months on average). Thus, to an investor trying to avoid dilution through an option pool, determining the number of shares needed to meet these expectations will be more important than the overall size of the option pool.
While the overriding factor ultimately should be a company's hiring and compensation expectations, this data set should offer a helpful guide in determining whether a current total option pool (or proposed increase) is market when negotiating a financing term sheet. Typically, the most effective way for management to negotiate the size of an option pool with potential investors is to build a bottom-up analysis showing expected hiring and equity allocations. Wilson Sonsini Goodrich & Rosati will continue to monitor and report on these trends. 1See "Starting Up: Sizing the Stock Option Pool," THE ENTREPRENEURS REPORT: Private Company Financing Trends, Summer 2008.
This communication is provided for your information only and is not intended to constitute professional advice as to any particular situation. Please note that the opinions expressed in this newsletter are the authors' and do not necessarily reflect the views of the firm or other Wilson Sonsini Goodrich & Rosati attorneys. © 2013 Wilson Sonsini Goodrich & Rosati, Professional Corporation Click here for a printable version of The Entrepreneurs Report |
||||||||||||||||||||||||||||||||||||||||||||||||||||||||||||||||||||||||||||||||||||||||||||||||||||||||||||||||||||||||||||||||||||||||||||||||||||||||||||||||||||||||||||||||||||||||||||||||||||||||||||||||||||||||||||||||||||||||||||||||||||||||||||||||||||||||||||||||||||||||||||||||||||||||||||||||||||||||||||||||||||||||||||||||||||||||||||||||||
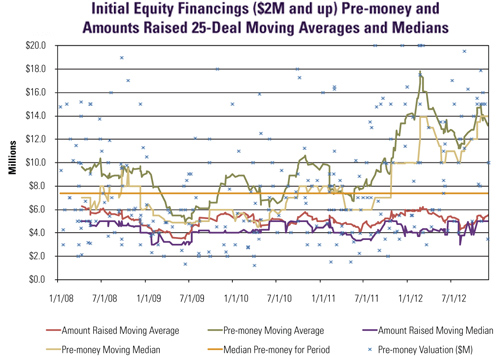 As part of the Report, we noted that since late 2011 there has been a substantial and broad-based increase in pre-money valuations in first-round equity financings. For most of the period, the median pre-money valuation (looking at 25 deals at a time) ranged between $5 million and $8 million, with a roughly year-and-a-half period in which the median never exceeded $6 million, corresponding with the time of the financial crisis and its aftermath. The median pre-money valuation for the entire period was only $7 million. But in late 2011, pre-money valuations started to increase dramatically, first to $10 million and then for a time to $14 million. As noted in the Report, this result seemed very surprising—during portions of the spring of 2012, 12 of the preceding 25 first-round venture financings had pre-money valuations at or exceeding twice the median for the period.
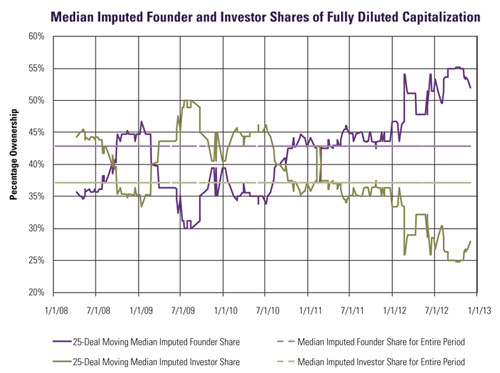 In the meantime, we are presenting in this issue another way of looking at the results of the study. The chart to the left shows the implications of pre-money valuations—and especially the recent higher valuations—on the relative ownership in a new venture between founders and investors. After all, the dollars of pre-money valuations are somewhat arbitrary and merely a means to allocate proportional ownership and control between founders and investors after the first financing. Using the pre-money valuation and the amount invested, we calculated implied founders' and investors' percentage ownership of the fully diluted capitalization of the newly funded company.
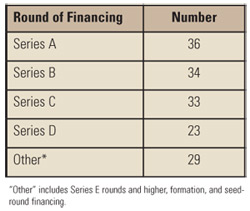 To answer these questions, we reviewed 155 financings from January 2011 through December 2012, allocated across rounds as shown in the chart to the left.
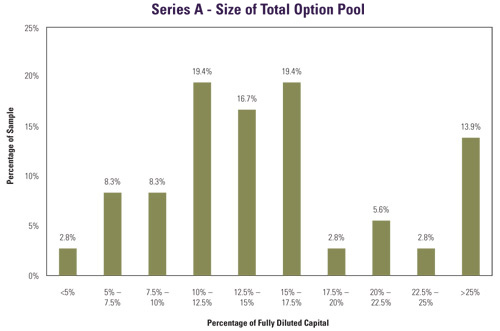 As indicated, more than 58% of Series A total option pools constitute between 10% and 20% of fully diluted capital. This result is broadly consistent with the findings of the 2008 study, which found approximately 54% of Series A financings closed with a total option pool that ranged between 11% and 20%.
 Although there are significant deviations from these averages and medians, as illustrated by the graph of the Series A total option pools above, the standard deviation does decline as companies mature, from 8.46% of the average size of the pool for companies following a Series A financing to 5.79% following a Series D transaction.
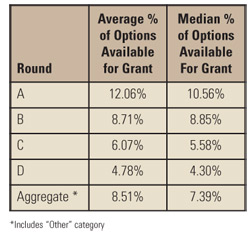 Our data shows that as companies progress through rounds of financing, there is a clear decrease in the number of ungranted shares in an option pool (an average of 12.06% following Series A rounds to 4.78% following Series D rounds).