|
From the WSGR Database: Financing Trends for Q3 2017
For purposes of the statistics and
charts in this report, our database
includes venture financing
transactions in which Wilson
Sonsini Goodrich & Rosati
represented either the company or
one or more of the investors.
|
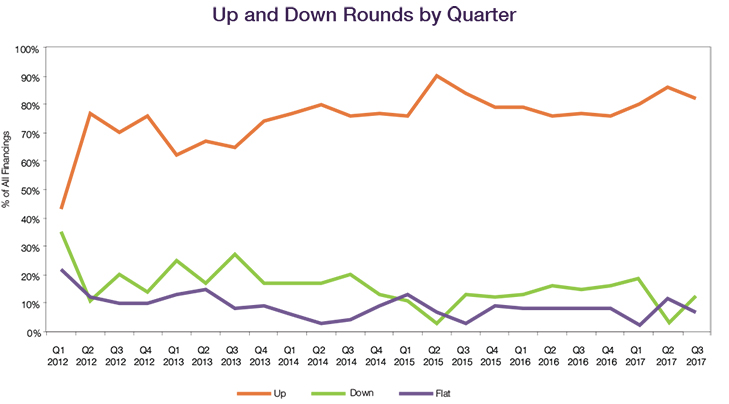
The strong venture financing market of 2017 has continued in Q3. Amounts raised in Q3 2017 kept pace with the near-record highs earlier in the year. In addition, up rounds constituted 82% of Q3 2017 Series B and later financings, a proportion similar to those in Q1 and Q2.
This strong venture financing market does show signs of cooling, however. As reported elsewhere, overall deal volume declined, as did median pre-money valuations. Median pre-money valuations for Series C and later financings were hit particularly hard, falling from $149.0 million in Q2 2017 to $87.7 million in Q3—even though the median amount raised was slightly higher in Q3 deals than in Q2.
The median amounts raised in bridge loans fell sharply in Q3 2017, to just above half the amounts of the prior quarter, making the lowest medians in the past
five years. More post-Series A bridges had interest rates greater than 8%, and maturity periods of less than 12 months, reflecting a continuing trend towards smaller, shorter-term, higher-rate loans.
Later-stage companies that are able to raise money appear to be raising as much cash as possible while the market remains relatively healthy, but the declining number of transactions indicates that over the next several quarters, many other later-stage companies will either need to hunker down or face the possibility of failing.
Up and Down Rounds
Up rounds fell slightly in Q3 2017, constituting 82% of Series B and later financings versus 86% in Q2, but higher than the five-year median of 80%. That decrease was mirrored by a notable uptick in down rounds, rising 10 percentage points from the prior quarter to 12%. The percentage of flat rounds also decreased, from 2% in Q2 2017 to 12% in Q3 2017.
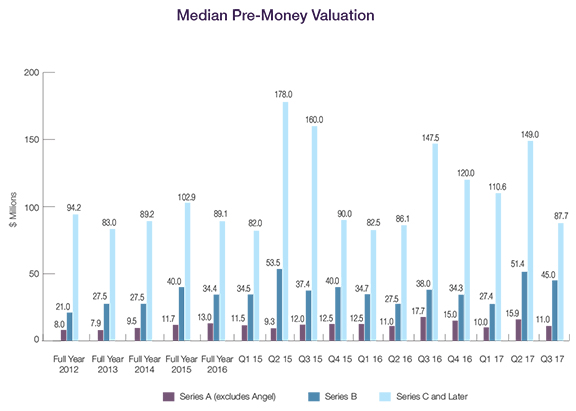 Valuations
Pre-money valuations were down for all financing rounds in Q3 2017, with late- stage financings taking the most significant hit. Early-stage valuations fell from the near- record high of $15.9 million in Q2 2017 to
$11.0 million in Q3. The median pre-money valuation for Series B rounds also saw a decrease from the prior quarter, dropping from $51.4 million in Q2 2017 to $45.0 million in Q3, though still well above the Q1 median pre-money valuation of $27.4 million. The median pre-money valuation for Series C and later deals took the largest tumble, falling from $149.0 million in Q2 2017 to $87.7 million in Q3 2017, although remaining close to the full-year 2016 median of $89.1 million.
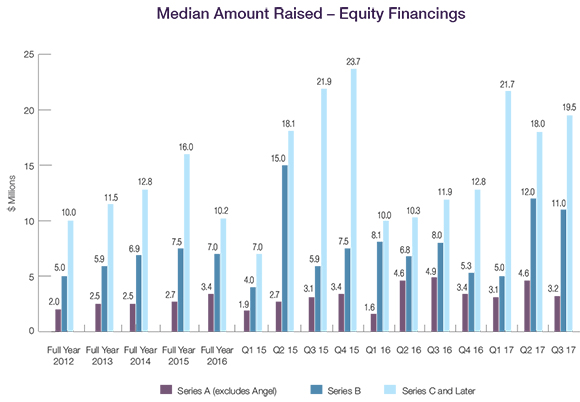 Amounts Raised Amounts Raised
The median amount raised for Seed and Series A rounds fell from the near-record high of $4.6 million in Q2 2017 to $3.2 million in Q3. The median amount raised for Series B rounds closely tracked to that of Q2 2017, dipping only slightly from $12.0 million to $11.0 million in Q3, and still well over the 2016 full-year median of $7.0 million.
While pre-money valuations for Series C and later financings decreased in Q3 2017, the median amount raised in Series C and later financings rose, from $18.0 million in Q2 2017 to $19.5 million in Q3 2017. One mega-deal that raised over $100 million in Q3 contributed to the high median, but even excluding this deal, the median amount raised remained above average at $16.2 million, exceeding the five-year median of $13.6 million.
Deal Terms - Preferred
The use of senior liquidation preferences in post-Series A rounds declined slightly, from 38% of all such rounds in 2016 to 34% in Q1-Q3 2017. Pari passu liquidation preferences increased from 57% of all such rounds in 2016 to 63% in Q1-Q3 2017.
The percentage of financings with no participation increased from 81% in 2016 to 86% in Q1-Q3 2017, a higher percentage than in any of the prior four full years. When looking only at down rounds, however, the percentage of financings with no participation fell dramatically from 74% in 2016 to 38% in Q1-Q3, while those with participation conversely increased significantly from 26% in 2016 to 61% in Q1-Q3 2017—the inverse of the 2016 distribution of non-participating vs. participating down-round financings.
Data on deal terms such as liquidation preferences, dividends, and others are set forth in the table below. To see how the terms tracked in the table can be used in the context of a financing, we encourage you to draft a term sheet using our automated Term Sheet Generator, which is available in the Start-Ups and Venture Capital section of the firms website at www.wsgr.com.
Private Company Financing Deal Terms (WSGR Deals)1
|
2014 |
2015 |
2016 |
Q1-Q3 2017 |
2014 |
2015 |
2016 |
Q1-Q3 2017 |
2014 |
2015 |
2016 |
Q1-Q3 2017 |
All Rounds2 |
All Rounds2 |
All Rounds2 |
All Rounds2 |
Up Rounds3 |
Up Rounds3 |
Up Rounds3 |
Up Rounds3 |
Down Rounds3 |
Down Rounds3 |
Down Rounds3 |
Down Rounds3 |
Liquidation Preferences - Series B and Later |
Senior |
40% |
33% |
38% |
34% |
32% |
31% |
36% |
29% |
68% |
35% |
41% |
62% |
Pari Passu with Other Preferred |
56% |
62% |
57% |
63% |
64% |
66% |
62% |
68% |
21% |
53% |
45% |
38% |
Junior |
0% |
1% |
1% |
0% |
0% |
1% |
0% |
3% |
0% |
0% |
5% |
0% |
Complex |
2% |
3% |
4% |
3% |
2% |
1% |
2% |
0% |
5% |
12% |
9% |
0% |
Not Applicable |
3% |
1% |
0% |
0% |
2% |
1% |
0% |
0% |
5% |
0% |
0% |
0% |
Participating vs. Non-participating |
Participating - Cap |
12% |
8% |
9% |
5% |
14% |
11% |
10% |
4% |
13% |
12% |
22% |
38% |
Participating - No Cap |
14% |
11% |
11% |
9% |
11% |
12% |
13% |
11% |
32% |
35% |
4% |
23% |
Non-participating |
74% |
81% |
81% |
86% |
76% |
77% |
77% |
85% |
55% |
53% |
74% |
38% |
Dividends |
Yes, Cumulative |
13% |
3% |
6% |
5% |
11% |
3% |
7% |
6% |
24% |
24% |
22% |
15% |
Yes, Non-cumulative |
72% |
82% |
73% |
77% |
74% |
86% |
78% |
78% |
71% |
76% |
70% |
77% |
None |
15% |
15% |
21% |
17% |
15% |
11% |
15% |
16% |
5% |
0% |
9% |
8% |
Anti-dilution Provisions |
Weighted Average - Broad |
85% |
80% |
92% |
94% |
90% |
86% |
92% |
96% |
92% |
75% |
91% |
100% |
Weighted Average - Narrow |
9% |
13% |
1% |
3% |
6% |
12% |
1% |
2% |
5% |
19% |
0% |
0% |
Ratchet |
1% |
1% |
1% |
0% |
1% |
1% |
2% |
0% |
0% |
0% |
0% |
0% |
Other (Including Blend) |
1% |
1% |
3% |
1% |
1% |
1% |
3% |
1% |
0% |
0% |
9% |
0% |
None |
4% |
5% |
3% |
3% |
2% |
1% |
2% |
1% |
3% |
6% |
0% |
0% |
Pay to Play - Series B and Later |
Applicable to This Financing |
4% |
5% |
5% |
3% |
1% |
3% |
3% |
3% |
16% |
18% |
9% |
8% |
Applicable to Future Financings |
0% |
1% |
1% |
0% |
0% |
0% |
1% |
0% |
0% |
12% |
0% |
0% |
None |
96% |
94% |
94% |
97% |
99% |
97% |
96% |
97% |
84% |
71% |
91% |
92% |
Redemption |
Investor Option |
17% |
13% |
11% |
12% |
22% |
19% |
20% |
21% |
24% |
12% |
9% |
17% |
Mandatory |
3% |
2% |
2% |
7% |
3% |
3% |
3% |
8% |
3% |
0% |
0% |
0% |
None |
80% |
85% |
87% |
81% |
75% |
78% |
77% |
71% |
74% |
88% |
91% |
83% |
| 1 We based this analysis on deals having an initial closing in the period to ensure that the data clearly reflects current trends. Please note the numbers do not always add up to 100% due to rounding. |
| 2 Includes flat rounds and, unless otherwise indicated, Series A rounds. |
| 3 Note that the All Rounds metrics include flat rounds and, in certain cases Series A financings as well. Consequently, metrics in the All Rounds column may be outside the ranges bounded by the Up Rounds and Down Rounds columns, which will not include such transactions. |
| |
Bridge Loans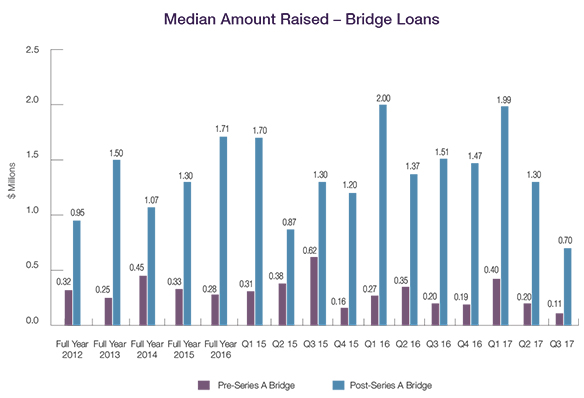
The median amount raised in pre-Series A bridges tumbled from $0.20 million in Q2 2017 to $0.11 million in Q3, well below the $0.28 million median for full-year 2016. The median amount raised in post-Series A bridges similarly fell, declining from $1.30 million in Q2 2017 to $0.70 million in Q3, representing a $1.0 million decline from the full-year 2016 median.
Deal Terms – Bridge Loans
The percentage of pre-Series A bridge loans subordinated to other debt rose from 20% in 2016 to 28% in Q1-Q3 2017. The number of pre-Series A bridge loans that are convertible into equity at discounted prices increased from 82% in 2016 to 84% in Q1-Q3 2017, though 86% of those that do convert at a discount received a discount rate of 20% or more on conversion.
Twenty-two percent of post-Series A bridge loans had interest rates greater than 8% in Q1-Q3 2017a significant increase from the 17% figure in 2016. In addition, the percentage of loans with maturity periods of less than 12 months increased from 29% in 2016 to 41% in Q1-Q3 2017, reflecting a trend toward shorter-term, higher-rate loans. Warrants were included in 18% of post-Series A bridge loans, in line with the 17% of such loans having warrants in 2016. Of those with warrants, 50% had warrant coverage under 25% in Q1-Q3 2017, up from 23% in 2016, and those with coverage of 25% or more dropped from 77% in 2016 to 50% in Q1-Q3 2017.
Bridge Loans Deal Terms (WSGR Deals)1
Bridge Loans |
2014
Pre-Series
A |
2015
Pre-Series
A |
2016
Pre-Series
A |
Q1-Q3 2017
Pre-Series
A |
2014
Post-Series
A |
2015
Post-Series
A |
2016
Post-Series
A |
Q1-Q3 2017
Post-Series
A |
Interest rate less than 8% |
72% |
74% |
76% |
76% |
43% |
54% |
52% |
54% |
Interest rate at 8% |
22% |
19% |
19% |
20% |
42% |
33% |
30% |
24% |
Interest rate greater than 8% |
6% |
7% |
5% |
4% |
15% |
13% |
17% |
22% |
Maturity less than 12 months |
12% |
17% |
17% |
20% |
24% |
34% |
29% |
41% |
Maturity at 12 months |
16% |
9% |
5% |
12% |
39% |
8% |
23% |
17% |
Maturity more than 12 months |
71% |
74% |
78% |
68% |
37% |
58% |
49% |
41% |
Debt is subordinated to other debt |
22% |
15% |
20% |
28% |
48% |
38% |
45% |
35% |
Loan includes warrants2 |
5% |
3% |
8% |
0% |
19% |
25% |
17% |
18% |
Warrant coverage less than 25% |
20% |
100% |
80% |
N/A |
69% |
47% |
23% |
50% |
Warrant coverage at 25% |
0% |
0% |
0% |
N/A |
0% |
7% |
15% |
17% |
Warrant coverage greater than 25% |
80% |
0% |
20% |
N/A |
31% |
47% |
62% |
33% |
Principal is convertible into equity3 |
98% |
93% |
97% |
96% |
94% |
86% |
92% |
91% |
Conversion rate subject to price cap4 |
67% |
64% |
79% |
76% |
23% |
26% |
29% |
30% |
Conversion to equity at discounted price5 |
81% |
78% |
82% |
84% |
73% |
71% |
74% |
81% |
Discount on conversion less than 20% |
10% |
11% |
12% |
14% |
25% |
25% |
25% |
24% |
Discount on conversion at 20% |
72% |
73% |
76% |
81% |
44% |
47% |
49% |
48% |
Discount on conversion greater than 20% |
17% |
16% |
12% |
5% |
32% |
27% |
26% |
27% |
Conversion to equity at same price as other investors |
16% |
18% |
13% |
4% |
24% |
25% |
19% |
19% |
1 We based this analysis on deals having an initial closing in the period to ensure that the data clearly reflects current trends. Please note the numbers do not always add up to 100% due to rounding.
2 Of the 2014 post-Series A bridges with warrants, 38% also had a discount on conversion into equity. Of the 2015 post-Series A bridges with warrants, 58% also had a discount on conversion into equity. Of the 2016 post-Series A bridges with warrants, 33% also had a discount on conversion into equity. Of the Q1-Q3 2017 post-Series A bridges with warrants, 63% also had a discount on conversion into equity.
3 Of the 2016 pre-Series A convertible bridges, 90% had automatic conversion and 10% had voluntary conversion. Of the Q1-Q3 2017 pre-Series A convertible bridges, 92% had automatic conversion and 8% had voluntary conversion. Of the 2016 post-Series A convertible bridges, 92% had automatic conversion and 8% had voluntary conversion. Of the Q1-Q3 2017 post-Series A convertible bridges, 88% had automatic conversion and 12% had voluntary conversion. The 2016 median dollar threshold for a qualified financing in pre- and post-Series A bridges was $1 million and $4 million, respectively. The Q1-Q3 2017 median dollar threshold for a qualified financing in pre- and post-Series A bridges was $2 million and $7 million, respectively.
4 The 2016 median price cap in pre- and post-Series A bridges was $6 million and $25 million, respectively. The Q1-Q3 2017 median price cap in pre- and post-Series A bridges was $8 million and $23 million, respectively.
5 Of the 2014 post-Series A bridges that had a discount on conversion into equity, 10% also had warrants. Of the 2015 post-Series A bridges that had a discount on conversion into equity, 21% also had warrants. Of the 2016 post-Series A bridges that had a discount on conversion into equity, 8% also had warrants. Of the Q1-Q3 2017 post-Series A bridges that had a discount on conversion into equity, 15% also had warrants.
|
[back to top]
Methodology for WSGR's Entrepreneurs Report
The Up/Down/Flat analysis is based on WSGR deals having an initial closing in the period reported to ensure that the data clearly reflects current trends. The median pre-money valuation is calculated based on the pre-money valuation given at the time of the initial closing of the round. If the issuer has a closing in a subsequent quarter, the original pre-money valuation is used in the calculation of the median for that quarter as well. A substantial percentage of deals have multiple closings that span fiscal quarters. The median amount raised is calculated based on the aggregate amount raised in the reported quarter. For purposes of this report, Series Seed transactions are included with Series A transactions.
Recent Publications
Our publications can help you stay informed about trending topics and updates in your industry and beyond.
Visit our website at www.wsgr.com and select Insight to see the newest publications and resources, including our most recent venture finance and industry newsletters.
Newsletters
Start-Up/Venture Finance
Industry Newsletters
|
Dow Jones VentureSource Ranks WSGR No. 1 for Q1-Q3 2017 Venture Financings
Dow Jones VentureSource recently ranked Wilson Sonsini Goodrich & Rosati as the leading law firm for U.S. venture financings in the first, second, and third quarters of 2017.
Dow Jones VentureSources legal rankings for Q1-Q3 2017 issuer-side venture financing deals placed WSGR ahead of all other firms by the total number of rounds of equity financing raised on behalf of clients. The firm is credited as the legal advisor in 154 rounds of financing, while its nearest competitor advised on 115 rounds of financing.
According to VentureSource, WSGR ranked first for Q1-Q3 2017 issuer-side U.S. deals in the following industries: business and financial services, clean technology, communications and networking, consumer goods, electronics and computer hardware, energy and utilities (tie), healthcare, industrial goods and materials, information technology, medical devices and equipment, and software. The firm ranked second in biopharmaceuticals and consumer services.
In the Bay Area region, WSGR was credited with 82 venture deals in Q1-Q3 2017, while its nearest competitor advised on 40 deals. In addition, the firm ranked first in the Pacific Northwest and Texas.
|
To learn more about WSGR's full suite of services for entrepreneurs and early-stage companies, please visit the Start-Ups and Venture Capital section of wsgr.com.
For more information about this report or if you wish to be included on the email subscription list, please email us at EntrepreneursReport@wsgr.com. There is no subscription fee. |
This communication is provided as a service to our clients and friends and is for informational purposes only. It is not intended to create an attorney-client relationship or constitute an advertisement, a solicitation, or professional advice as to any particular situation.
© 2017 Wilson Sonsini Goodrich & Rosati, Professional
Corporation
Click here for a printable version of The Entrepreneurs Report |