
Q3 2011 From the WSGR Database: Financing Trends for Q3 2011
In the third quarter of 2011, positive trends in venture capital financing terms largely continued, with a relatively large number of later-round financings having higher valuations than the prior round, and ongoing relatively high valuations at all stages of development. These trends likely indicate that funds have been able to exit investments in struggling portfolio companies or have otherwise been able to rationalize investments in higher growth opportunities, and also reflect continuing overall improvement in many technology sectors. Since many of the financings that closed in the third quarter were based on terms agreed to late in the second quarter and early in the third quarter, prior to the ongoing volatility in the public markets that began in mid-August, it is possible that these trends will not continue in the fourth quarter.
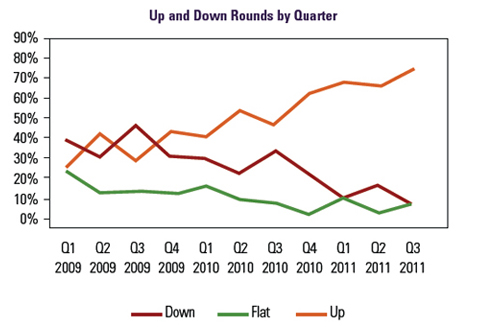
Up rounds continued to comprise the substantial majority of equity financings in Q3 2011, at 78% of all deals. This figure represents a notable increase over Q2 2011 (71%) and Q1 2011 (72%), and the continuation of a trend since Q1 2010, where up rounds comprised only 45% of all deals, an increase of more than 30 percentage points. Conversely, down rounds as a percentage of all deals decreased from the prior quarter, from 21% in Q2 2011 to 11% in Q3. This also reflects the continuation of a trend that has seen the percentage of down rounds decrease from 35% in Q1 2010. Flat rounds increased from 8% in Q2 2011 to 11% in Q3.
Valuations
Q3 valuations for more established companies showed mixed results versus those in prior quarters. Median pre-money valuations for Series B transactions increased from $17.8 million in Q2 2011 to $20.3 million in Q3, although both figures were down substantially from the $30.0 million median Series B pre-money valuation in Q1 2011. For companies raising funds in Series C and later rounds, median pre-money valuations declined modestly, to $62.7 million in Q3 2011 from $70.0 million in Q2 and $72.3 million in Q1. Overall, valuations at all levels in Q3 were higher than those in Q1 2010, and reflect a more positive investment environment, largely driven by a robust mergers and acquisitions market and an improvement (until recently) in the public markets.
Median amounts raised in closings in Q3 2011 compared to the prior quarter were up for Series A and Series B rounds, and down for Series C rounds. For non-angel Series A rounds, median amounts raised rose to $2.8 million in Q3 from $2.3 million in Q2. Median amounts raised for Series B rounds increased markedly, from $3.8 million in Q2 2011 to $8.3 million in Q3, similar to the $8.0 million and $8.3 million figures for Q1 2011 and Q4 2010. For Series C and later rounds, median amounts raised decreased from $12.3 million in Q2 2011 to $10.1 million in Q3.1
Liquidation preferences. The most notable trend in Q3 2011 was the relative increase in the use of pari passu liquidation preferences as compared with senior preferences. In Q1 and Q2, these terms were used roughly equally, but in Q3 2011, pari passu liquidation preferences appeared in 150% more deals than senior liquidation preferences. Specifically, in Q3 2011, Series B and later rounds had senior liquidation preferences in 38% of deals, down from 51% in Q2 2011. The prevalence of such preferences decreased in both up rounds (from 41% in Q2 to 29% in Q3) and down rounds (from 78% to 50%). Conversely, the use of pari passu liquidation preferences increased overall from 47% in Q2 to 60% in Q3, particularly in up rounds (from 59% to 67%). Interestingly, there was a substantial increase in the use of pari passu liquidation preferences in down rounds (from 11% in Q2 to 50% in Q3), although this may have been affected by the small sample size. Participation rights. The proportion of Q3 2011 deals with non-participating preferred stock decreased from 63% in Q2 2011 to 52% in Q3. The proportion decreased in up rounds from 68% in Q2 to 51% in Q3. There was an increase in the proportion of down-round deals with non-participating preferred stock (from 40% in Q2 to 50% in Q3), although again this may be due in part to the small sample size. Among participating preferred stock deals, the percentage of deals with capped participating preferred increased markedly, from an average of 9% in 1H to 23% in Q3 2011, while the percentage of deals with non-capped participating decreased from 30% to 25%. Interestingly, the use of capped participating stock deals increased in up rounds (from 9% in Q2 to 24% in Q3.) Anti-dilution provisions. Broad-based weighted-average anti-dilution was overwhelmingly prevalent, and its proportional use stayed relatively constant, at 93% of all deals in Q3 2011 as compared with 92% in Q2 2011. The use of narrow-based weighted-average declined from 3% to 2%, and ratchet anti-dilution went from 2% to 0%. Pay-to-play provisions. The use of pay-to-play provisions increased from 1H 2011 to Q3 2011, from 9% of deals to 12%. While usage actually decreased in down rounds, from 30% of deals in Q2 to 0% in Q3, this decline was outweighed by the increase in up rounds, where pay-to-play usage rose from 6% of deals in Q2 to 14% in Q3. The relatively small changes may be a statistical anomaly, again due to a relatively small sample size. Redemption. The use of redemption provisions increased from 22% of deals in 1H 2011 to 30% in Q3 2011. Investor-option redemption (used in 26% of deals in Q3) continued to be far more popular than mandatory redemption (4%).
Private Company Financing Trends (WSGR Deals)2
This communication is provided for your information only and is not intended to constitute professional advice as to any particular situation. Please note that the opinions expressed in this newsletter are the authors' and do not necessarily reflect the views of the firm or other Wilson Sonsini Goodrich & Rosati attorneys. © 2011 Wilson Sonsini Goodrich & Rosati, Professional Corporation Click here for a printable version of The Entrepreneurs Report |
|||||||||||||||||||||||||||||||||||||||||||||||||||||||||||||||||||||||||||||||||||||||||||||||||||||||||||||||||||||||||||||||||||||||||||||||||||||||||||||||||||||||||||||||||||||||||||||||||||||||||||||||||||||||||||||||||||||||||||||||||||||||||||||||||||||||||||||||||||||||||||||||||||||||||||||||||||||||||
 Up and Down Rounds
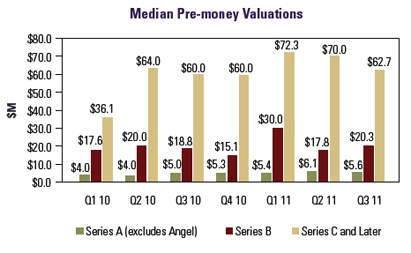 The average valuation for first-round venture investments in Q3 2011 was slightly lower than in Q2 2011, but higher than any other of the last seven quarters. The median pre-money valuation for closings in Q3 2011 Series A rounds (other than angel deals) was $5.6 million, down from $6.1 million in Q2 2011 but higher than $5.4 million in Q1 2011 and $5.3 million in Q4 2010.
 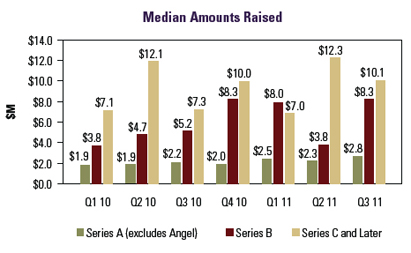 Amounts Raised