From the WSGR Database: Financing Trends for Q1 2014
For purposes of the statistics and
charts in this report, our database
includes venture financing
transactions in which Wilson
Sonsini Goodrich & Rosati
represented either the company or
one or more of the investors.
|
Wilson Sonsini Goodrich & Rosati's experience confirms reports that the market remains positive overall, with up rounds comprising more than three-quarters of all venture deals in Q1 2014, the highest proportion in several years. As reported by both Dow Jones Venture Source and Pitchbook, the number of venture deals continued to decline in Q1 2014, a trend since Q1 2013, while amounts raised remained generally robust.
Both median amounts raised and median pre-money valuations declined from 2013 to Q1 2014 for seed, Series A,1 and Series B transactions. Although valuations and amounts raised in Series C and later deals in Q1 2014 were below those of Q4 2013, they remained higher than full-year 2013 valuations and amounts.
As discussed below, deal terms in Q1 2014 remained broadly comparable to those in 2013. Notable trends include an increase in the use of senior liquidation preferences and the continuing gradual decrease in the use of participating preferred.
1Note that seed transactions are included in Series A metrics.
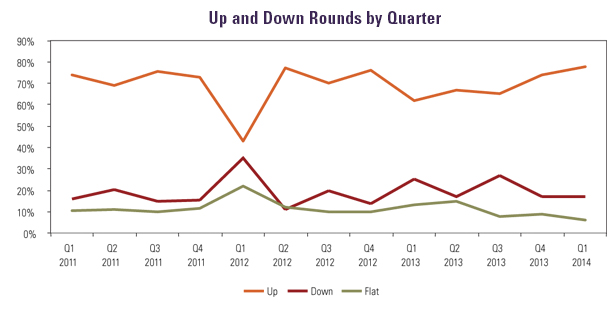
Up and Down Rounds
The year started well for most start-ups raising follow-on money in the first quarter, with up rounds representing 78% of all new financings in Q1 2014, up from 74% in Q4 2013. The percentage of down rounds remained constant at 17%, while flat rounds decreased from 9% of all deals in Q4 2013 to 6% in Q1 2014. |
 |
|
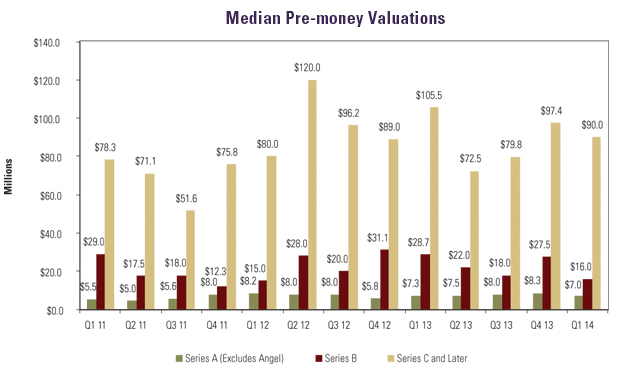
Valuations
The median company pre-money valuation in Series A deals backed by venture and corporate strategic investors was $7.0 million in Q1 2014, down from a high of $8.3 million in Q4 2013 but still strong by historical levels. The median Series B pre-money valuation for Q1 2014 was $16.0 million, the lowest amount since Q1 2012. The median pre-money valuation for Series C and later rounds was $90.0 million in Q1 2014, lower than the $97.4 million in Q4 2013, but higher than the median valuation of $83.0 million for full-year 2013.
|
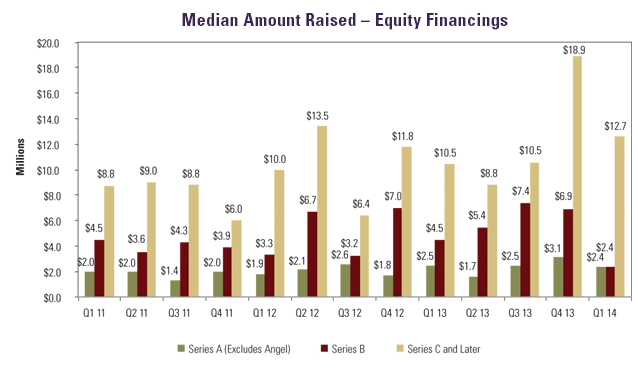
Amounts Raised
Start-ups generally raised smaller amounts in Q1 2014 than in 2013, particularly in Series B financings. For VC and corporate strategic Series A deals, the median amount raised decreased to $2.4 million from the unusually high level of $3.1 million for closings in Q4 2013,2 though the former amount was only slightly lower than the full-year median amount of $2.5 million. The median for Series B closings declined precipitously from $6.9 million in Q4 2013 (and $5.4 million for full-year 2013) to $2.4 million in Q1 2014. For Series C and later transactions, the median amount raised in Q1 2014 was $12.7 million, less than the $18.9 million in Q4 2013 but higher than the $11.5 million for full-year 2013.
2The Q4 2013 median for venture-backed and strategic Series A deals was the highest in at least four years. |
|
Deal Terms
Liquidation preferences. More deals carried senior liquidation preferences in Q1 2014 than any year since 2011, rising from 41% of all rounds in 2013 to 46% in Q1 2014. For Q1 2014 up rounds, 38% of financings had senior liquidation preferences, the same figure as in 2013, whereas in down rounds the use of such preferences jumped from 47% of all deals in 2013 to 67% in Q1 2014. Part of this increase may be the result of a switch from complex preference structures in down rounds, which fell from 11% of all transactions in 2013 to zero in Q1 2014.
Participation rights. Overall, the use of participating preferred continued to decrease, from 30% of all deals in 2013 to 28% in Q1 2014. Much of this decline was in down rounds, where usage declined from 53% of all deals in 2013 to 33% in Q1 2014. Conversely, the use of participation rights in up rounds increased from 30% of all financings in 2013 to 39% in Q1 2014, primarily because the use of uncapped participating preferred in such rounds rose from 10% of deals in 2013 to 18% in Q1 2014.
Dividends. Non-cumulative dividends were used in 75% of deals in Q1 2014, virtually unchanged from the figure of 74% for full-year 2013. Cumulative dividends declined from 12% of all deals in 2013 to 10% in Q1 2014.
Anti-dilution provisions. The use of broad-based weighted-average anti-dilution provisions also remained nearly constant between 2013 and Q1 2014, rising slightly from 95% of all deals to 96%.
Pay-to-play provisions. The use of pay-to-play provisions applicable to current financings rose from 5% of all deals in 2013 to 14% in Q1 2014, while pay-to-play provisions applicable to future financings fell from 1% to zero.
Redemption. The use of investor-option redemption provisions increased from 19% of all deals in 2013 to 24% in Q1 2014. This increase resulted primarily from the doubling of the usage of such provisions in down rounds, from 33% of such deals in 2013 to 67% in Q1 2014.
To see how the terms tracked in the table below can be used in the context of a financing, we encourage you to draft a term sheet using our automated Term Sheet Generator. You'll find a link in the
Entrepreneurial Services section of the firm's website (www.wsgr.com), along with information about the wide variety of services that Wilson Sonsini Goodrich & Rosati offers to entrepreneurs and early-stage companies.
Private Company Financing Trends
(WSGR Deals)1
|
2011 |
2012 |
2013 |
Q1 2014 |
2011 |
2012 |
2013 |
Q1 2014 |
2011 |
2012 |
2013 |
Q1 2014 |
All Rounds2 |
All Rounds2 |
All Rounds2 |
All Rounds2 |
Up Rounds3 |
Up Rounds3 |
Up Rounds3 |
Up Rounds3 |
Down Rounds3 |
Down Rounds3 |
Down Rounds3 |
Down Rounds3 |
Liquidation Preferences - Series B and Later |
Senior |
47% |
37% |
41% |
46% |
34% |
30% |
38% |
38% |
79% |
56% |
47% |
67% |
Pari Passu with Other Preferred |
51% |
58% |
55% |
54% |
64% |
67% |
60% |
62% |
18% |
39% |
37% |
33% |
Complex |
1% |
2% |
3% |
0% |
1% |
2% |
2% |
0% |
3% |
0% |
11% |
0% |
Not Applicable |
1% |
3% |
1% |
0% |
1% |
1% |
0% |
0% |
0% |
5% |
5% |
0% |
Participating vs. Non-participating |
Participating - Cap |
16% |
14% |
18% |
16% |
17% |
13% |
20% |
21% |
22% |
17% |
23% |
33% |
Participating - No Cap |
26% |
19% |
12% |
12% |
24% |
20% |
10% |
18% |
46% |
41% |
30% |
0% |
Non-participating |
58% |
67% |
70% |
72% |
59% |
67% |
69% |
61% |
32% |
41% |
48% |
67% |
Dividends |
Yes, Cumulative |
11% |
9% |
12% |
10% |
11% |
10% |
12% |
7% |
19% |
12% |
13% |
17% |
Yes, Non-cumulative |
78% |
78% |
74% |
75% |
79% |
81% |
79% |
79% |
73% |
78% |
79% |
67% |
None |
11% |
13% |
14% |
14% |
10% |
9% |
10% |
14% |
8% |
10% |
8% |
17% |
Anti-dilution Provisions |
Weighted Average - Broad |
91% |
92% |
95% |
96% |
91% |
92% |
96% |
96% |
80% |
85% |
97% |
100% |
Weighted Average - Narrow |
4% |
3% |
3% |
1% |
7% |
3% |
3% |
0% |
6% |
5% |
0% |
0% |
Ratchet |
3% |
3% |
1% |
3% |
2% |
2% |
0% |
4% |
6% |
8% |
3% |
0% |
Other (Including Blend) |
3% |
3% |
1% |
0% |
1% |
3% |
1% |
0% |
9% |
3% |
0% |
0% |
Pay to Play - Series B and Later |
Applicable to This Financing |
6% |
5% |
5% |
14% |
1% |
1% |
1% |
4% |
20% |
23% |
15% |
33% |
Applicable to Future Financings |
6% |
3% |
1% |
0% |
4% |
3% |
1% |
0% |
11% |
3% |
0% |
0% |
None |
88% |
92% |
95% |
86% |
94% |
96% |
98% |
96% |
69% |
74% |
85% |
67% |
Redemption |
Investor Option |
22% |
22% |
19% |
24% |
25% |
23% |
20% |
21% |
32% |
35% |
33% |
67% |
Mandatory |
2% |
1% |
1% |
1% |
2% |
1% |
2% |
4% |
3% |
3% |
0% |
0% |
None |
77% |
77% |
80% |
75% |
73% |
76% |
78% |
75% |
65% |
63% |
67% |
33% |
| 1We based this analysis on deals having an initial closing in the period to ensure that the data clearly reflects current trends. Please note that the numbers do not always add up to 100% due to rounding. |
| 2Includes flat rounds and, unless otherwise indicated, Series A rounds. |
| 3Note that the All Rounds metrics include flat rounds and, in certain cases, Series A financings as well. Consequently, metrics in the All Rounds column may be outside the ranges bounded by the Up Rounds and Down
Rounds columns, which will not include such transactions. |
| |
Bridge Loans
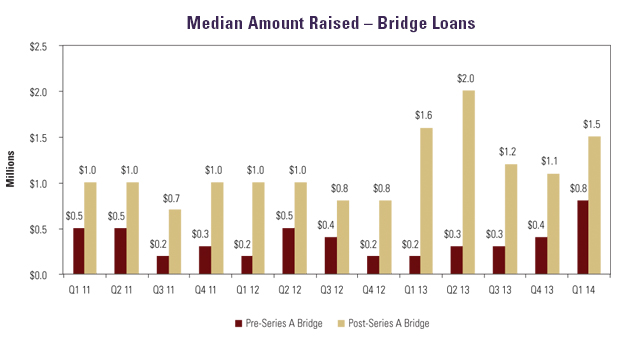 The median amount raised in bridge financings rose for both pre-Series A and post-Series A loans. For loans prior to a Series A financing, the median amount raised increased from $0.4 million in Q4 2013 to $0.8 million in Q1 2014, and for post-Series A loans, from $1.1 million in Q4 2013 to $1.5 million in Q1 2014. The median amount raised in bridge financings rose for both pre-Series A and post-Series A loans. For loans prior to a Series A financing, the median amount raised increased from $0.4 million in Q4 2013 to $0.8 million in Q1 2014, and for post-Series A loans, from $1.1 million in Q4 2013 to $1.5 million in Q1 2014.
Interest Rates. Rates for post-Series A bridge loans increased sharply. The proportion of bridge loans with rates below 8% dropped from 46% in 2013 to 16% in Q1 2014. Conversely, post-Series A loans with rates above 8% rose from 20% of all deals in 2013 to 32% in Q1 2014. Similarly, post-Series A loans with interest rates of exactly 8% rose from 34% of all deals in 2013 to 53% in Q1 2014.
Maturities. The maturity of post-Series A loans shortened considerably in Q1 2014, with 47% of those made in Q1 2014 being due in less than 12 months, a significant jump from the comparable 29% figure in 2013. Conversely, loans with maturities of more than 12 months declined from 33% of all deals in 2013 to 21% in Q1 2014.
Subordinated Debt. The use of subordinated debt dropped from 56% of post-Series A loans in 2013 to 50% in Q1 2014.
Warrants. The proportion of post-Series A bridge loans with warrants declined from 34% of all deals in 2013 to 26% in Q1 2014. And those deals that did have warrants saw a decrease in warrant coverage; the proportion of post-Series A deals with warrant coverage of less than 25% rose sharply, from 50% of all deals in 2013 to 75% in Q1 2014, whereas the proportion of deals with warrant coverage greater than 25% declined from 38% of deals in 2013 to 25% in Q1 2014.
Conversion. The percentage of post-Series A bridge loans subject to a price cap decreased slightly, from 14% of all deals in 2013 to 11% in Q1 2014. The percentage of post-Series A loans convertible at a discounted price increased markedly, to 83% of deals in Q1 2014 from 59% in 2013.
Multiples. Post-Series A bridge loans providing for repayment at a multiple of the loan value in the event of an acquisition increased from 17% of all deals in 2013 to 28% in Q1 2014.
Bridge Loans1 |
2012
Post-Series A |
2013
Post-Series A |
Q1 2014
Post-Series A |
Interest rate less than 8% |
44% |
46% |
16% |
Interest rate at 8% |
41% |
34% |
53% |
Interest rate greater than 8% |
15% |
20% |
32% |
Maturity less than 12 months |
34% |
29% |
47% |
Maturity at 12 months |
36% |
38% |
32% |
Maturity more than 12 months |
30% |
33% |
21% |
Debt is subordinated to other debt |
39% |
56% |
50% |
Loan includes warrants2 |
32% |
34% |
26% |
Warrant coverage less than 25% |
42% |
50% |
75% |
Warrant coverage at 25% |
33% |
12% |
0% |
Warrant coverage greater than 25% |
14% |
38% |
25% |
Warrant coverage described as variable or "other" |
12% |
0% |
0% |
Principal is convertible into equity3 |
97% |
94% |
95% |
Conversion rate subject to price cap |
24% |
14% |
11% |
Conversion to equity at discounted price4 |
52% |
59% |
83% |
Discount on conversion less than 20% |
15% |
16% |
7% |
Discount on conversion at 20% |
46% |
46% |
36% |
Discount on conversion greater than 20% |
39% |
38% |
57% |
Conversion to equity at same price as other investors |
38% |
35% |
17% |
Repayment at multiple of loan on acquisition |
22% |
17% |
28% |
1We based this analysis on deals having an initial closing in the period to ensure that the data clearly reflects current trends. Please note that the numbers do not always add up to 100% due to rounding.
2Of the 2013 post-Series A bridges with warrants, 24% also had a discount on conversion into equity. Of the Q1 2014 post-Series A bridges with warrants, 60% also had a discount on conversion into equity.
3 This includes notes that provide for voluntary as well as automatic conversion.
4Of the 2013 post-Series A bridges that had a discount on conversion into equity, 15% also had warrants. Of the Q1 2014 post-Series A bridges that had a discount on conversion into equity, 20% also had warrants.
|
[back to top]
For more information on the current venture capital climate, please contact any member of Wilson Sonsini Goodrich & Rosati's entrepreneurial services team. To learn more about WSGR's full suite of services for entrepreneurs and early-stage companies, please visit the Entrepreneurial Services section of wsgr.com.
For more information about this report or if you wish to be included on the email subscription list, please contact Eric Little. There is no subscription fee. |
This communication is provided as a service to our clients and friends and is for informational purposes only. It is not intended to create an attorney-client relationship or constitute an advertisement, a solicitation, or professional advice as to any particular situation..
© 2014 Wilson Sonsini Goodrich & Rosati, Professional
Corporation
Click here for a printable version of The Entrepreneurs Report |