
From the WSGR Database: Financing Trends for Q2 2014
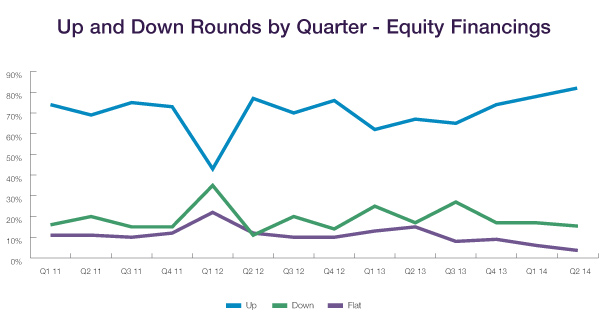
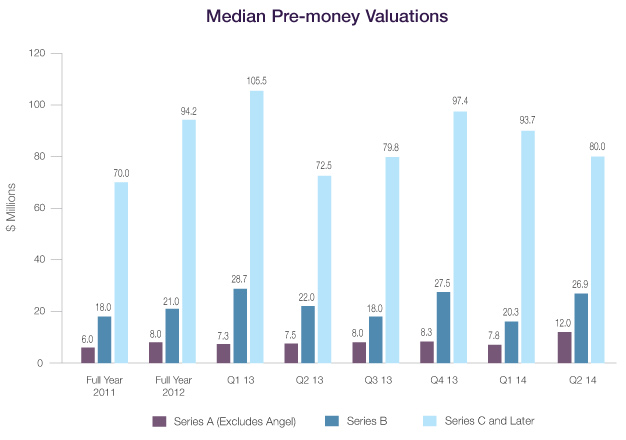
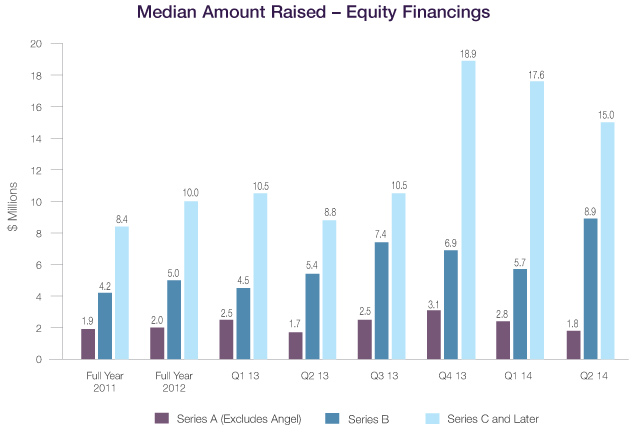
We are pleased to report that the venture market remained robust during the second quarter of 2014. Up rounds constituted the highest percentage of all deals in the WSGR database since the firm started tracking these numbers. The total amount invested was also at a record high in Q2, primarily because of a significant number of deals in both U.S. and foreign markets raising $100 million or more. Median amounts raised and pre-money valuations mostly retreated from recent highs, but remained strong. The median amount raised in Series B closings was notably the highest in recent memory, and pre-money valuations for venture-backed Series A transactions, sometimes referred to as the "new Series B" (in light of the growth of seed financings), were substantially higher than at any time since we started tracking medians in 2008. As noted above, many deals had very high pre-money valuations. The number of such deals has grown significantly since 2012; see Jordan Coleman's article below for an analysis of the differences in the terms of these deals compared with most venture financings.
Deal Terms Liquidation preferences. The first half of 2014 saw a reversal of the trend, previously reported in Q1, of more deals with senior liquidation preferences than in previous years. Only 37% of 1H 2014 deals had senior preferences, a decrease from 41% in 2013. In up rounds, which constituted more than 75% of all deals in 1H 2014, the use of senior liquidation dropped from 38% of all deals in 2013 to 30% in 1H 2014. The use of senior liquidation preferences in down rounds increased from 47% of all deals in 2013 to 67% in 1H 2014. Last quarter we attributed a portion of this increase to a move away from complex preference structures in down rounds, which fell from 11% of all transactions in 2013 to 0% in Q1 2014. As complex preference structures were not used in down rounds in Q2 as well, this conclusion appears to remain valid. Participation rights. Overall use of participating preferred stock increased slightly, from 30% of all deals in 2013 to 31% in 1H 2014. There was a greater increase in up rounds, where the use of participating preferred increased from 30% to 35%. We believe that this increase is due to the fact that late-stage deals, where participating preferred is more common, constituted a slightly higher percentage of all deals in 1H 2014 than in 2013. As to down rounds, where one would expect participating preferred to be more common, the percentage of deals having participation rights actually dropped from 53% of all down rounds in 2013 to 40% in 1H 2014. We believe that this is a statistical fluke due to the small number of down rounds in 1H 2014. Dividends. Non-cumulative dividends were used in 74% of all deals in 1H 2014, exactly the same as for full-year 2013. Use of cumulative dividends saw a big jump in down rounds, from 13% of such deals in 2013 to 27% in 1H 2014. Anti-dilution provisions. The use of broadbased weighted-average anti-dilution provisions also remained nearly constant between 2013 and 1H 2014, rising slightly from 95% of all deals to 96%. Other provisions. There were no statistically significant changes in the frequency of pay-to-play provisions or redemption features between 2013 and 1H 2014. The largest numeric change was in the percentage of investor option redemptions in down rounds, which climbed from 33% of such deals in 2013 to 40% in 1H 2014. However, as mentioned in connection with participation rights above, the number of down rounds was so small in 1H 2014 that it is difficult to have any confidence that this change represents an actual trend. To see how the terms tracked in the table below can be used in the context of a financing, we encourage you to draft a term sheet using our automated Term Sheet Generator. You'll find a link in the Entrepreneurial Services section of the firm's website (www.wsgr.com), along with information about the wide variety of services that Wilson Sonsini Goodrich & Rosati offers to entrepreneurs and early-stage companies.
Private Company Financing Trends (WSGR Deals)1
Bridge Loans
Interest Rates. Most pre-Series A loans carried an interest rate of less than 8% per annum in 2013 and 1H 2014. The percentage with interest rates above 8% rose from 1% of such loans in 2013 to 6% in 1H 2014. Post-Series A bridge loans with rates below 8% fell from 46% of loans in 2013 to 35% in 1H 2014, while the percentage of such loans carrying an even 8% interest per annum increased from 34% in 2013 to 50% in 1H 2014. Maturities. Maturities for pre-Series A bridge loans shortened somewhat, with the percentage of such deals having maturities of 12 months or longer declining from 97% of all deals in 2013 to 87% in 1H 2014. For post-Series A loans, maturities of 12 months or longer also declined, from 71% of all such loans in 2013 to 66% in 1H 2014. Subordinated Debt. The use of subordinated debt continued to increase for pre-Series A bridge loans, rising from 25% in 2013 to 38% in 1H 2014. For post-Series A loans, subordination declined from 56% of deals in 2013 to 48% in 1H 2014. Warrants. Few pre-Series A loans have warrants, so we did not examine trends in warrant coverage for those deals. For post-Series A loans, the use of warrants declined from 34% of deals in 2013 to 29% in 1H 2014. Conversion. The percentage of pre-Series A bridge loans subject to an explicit price cap on conversion jumped from 68% of deals in 2013 to 88% in 1H 2014. In addition, 94% of all loans in 1H 2014 were convertible at a discounted price, up slightly from 91% in 2013. The percentage of post-Series A bridge loans subject to a price cap also increased, although they remained a much smaller percentage of all deals, rising from 14% in 2013 to 23% in 1H 2014. The percentage of post-Series A loans convertible at a discounted price increased from 59% of deals in 2013 to 75% in 1H 2014. Multiples. Provision for repayment at a multiple of the loan value in the event of an acquisition fell for pre-Series A loans, from 25% of deals in 2013 to 19% in 1H 2014. The percentage of post-Series A loans with such a feature increased somewhat, from 17% in 2013 to 26% in 1H 2014. The numbers for each quarter of the current year are updated quarterly. Consequently, numbers and percentages in prior quarters may vary as the year progresses.
Trends in Bridge Loans
Price and Preference By Herb Fockler, Partner, and Eric Little, Knowledge Management Manager, Palo Alto It is a truth universally acknowledged that an investor in a venture-backed start-up must be paid its money back first. How the proceeds from an acquisition are divided after that, however, is up for grabs.
This is the first part of a two-part article1 on the importance of terms other than valuation in venture financings—in this case, whether or not the preferred stock issued to investors participates upon liquidation. This first part discusses the strong move from participating to non-participating preferred stock in recent years, as well as some possible reasons for that move. The second part looks more deeply into the economic results of this change. Part 1 Negotiation of a venture financing term sheet, especially at the Series A level, focuses to a great extent on valuation. Valuation determines relative ownership, and relative ownership is the primary, if not exclusive, basis for allocating the economics between founders and investors of a highly successful outcome for the venture—for example, an IPO. But exclusive focus on valuation ignores the key role that other provisions of the term sheet can have on the allocation of economics in the very broad range of other outcomes. The most important of these is the liquidation preference, both its amount and its details. Failure to consider this term carefully, especially at the time the Series A term sheet is negotiated, can have drastic effects on the allocation of the economics of downside and even some successful outcomes, obviously for founders and employees holding common stock, but also, perhaps surprisingly, for early investors holding Series A or B preferred stock. Our firm maintains a database of valuations and terms of thousands of venture financings in which we have been involved over the past decade. Given the size and comprehensiveness of this database, as well as our significant leading market share in the venture market, we believe that we are uniquely positioned to draw conclusions and spot trends in the market before any other participant.2 Recently, we have seen a significant shift in the component of the liquidation preference provision that governs what happens after the preferred stock's up-front liquidation preference has been satisfied. We believe that there are very good reasons for this trend, and that both founders and early-stage investors should take careful note of it. In almost every case, investors in venture start-ups get their money back first. In legal language, the preferred stock issued in venture financings is given a preference upon the liquidation of the company such that the preferred stockholders will be paid out of the assets available for distribution to equity holders an amount per share equal to their original purchase price before any of the assets are distributed to the common stockholders. This preference assures investors that, if the company must liquidate at a low valuation, they will stand towards the head of the line, right behind trade creditors and debt.3 It's called a "liquidation" preference, but its real effect is in the acquisition context, where the same rules apply. In fact, in a real liquidation of a venture start-up outside of the acquisition context, any remaining assets are likely to be too minimal for anyone to fight over. Except in special circumstances, such as laterstage down rounds, it is rare to see any deviation from this up-front return of an investor's original investment. In 2013, for example, except for instances in which accrued dividends were payable upon liquidation, less than 12% of deals (including down rounds and restructurings) involved preferred stock with a liquidation preference greater than the amount of the original investment. Regardless of the up-front liquidation preference amount of the preferred stock, once it has been satisfied in full, the remaining acquisition proceeds must be distributed. They can be (i) divided among both common and preferred stockholders according to their percentage ownership in the company, (ii) allocated entirely to the common stockholders, or (iii) allocated among common and preferred through a combination of the two methods. The first situation is called "full participation," and the preferred stock is called "participating preferred," reflecting that the preferred stockholders directly participate in the distribution of any value the company has created beyond the amount of their invested capital. In this situation, the preferred stockholders always will receive more on a per share basis than the common stockholders, no matter what the size of the acquisition.
Then there is the third, hybrid situation called "capped participation." In this situation, the preferred stockholders share in the proceeds remaining after payment of their liquidation preference as under full participation, but only up to a specified amount, typically where their total return (including their up-front liquidation preference) equals two or three times their original investment. Thereafter, all remaining proceeds are distributed to the common stockholders as under no participation. Again, at some point in the range of outcomes, the preferred stockholders will be able to obtain a greater return as holders of common stock than they would by continuing to hold their capped participating liquidation preference, and so they will convert to common. As discussed in the next few paragraphs, capped participation has been at times more prevalent than either full participation or no participation. But economically capped participation is really a subset of no participation—it's just that the point at which the preferred stockholders will choose to convert to common stock will be higher in terms of acquisition proceeds (sometimes, surprisingly so).
In recent years, however, this balance has shifted dramatically. As shown in the chart above, in 2013, no participation made up more than two-thirds of all cases. The shift is even more dramatic for Series A and seed financings. As shown in the top chart to the left, nearly 80% of such financings no longer have any participation rights, even capped participation, while only 7% have full participation. Viewing it another way, by 2013, the preferred stock issued in nearly 80% of all Series A and seed financings had no participation, while almost 22% of the preferred issued in Series D financings carried full participation rights. Looking only at 2013 (bottom left chart), the prevalence of the various types of participation varied substantially by round of financing, with no seed deals having fully participating preferred stock and less than 15% having even capped preferred. Preferred stock issued in Series D rounds, on the other hand, was more evenly distributed among the three types of participation. While there could be dynamics causing investors to ask for full participation more in later rounds, we believe that the primary explanation for this pattern in the 2013 graph is simply another reflection of the shift to no participation in recent years. Companies issuing Series D preferred stock in 2013 obviously raised money in their prior rounds in earlier years, when the choice in participation types was less skewed in favor of no participation. Thus, their earlier series were more likely to be either fully or capped participating preferred. That choice then carried over into later rounds, as a result of the strong bias among both companies and investors not to change the DNA of a company's preferred stock once it has been set in the Series A round. Hence, we believe that the distribution among full, capped, and no participation in Series D rounds in 2013 is likely not a significant indication of special factors in such rounds, especially since changing to participating preferred at some time would be a substantial change in that DNA. Why might the Series A investors be giving up participation rights so overwhelmingly in recent years, as they have clearly done? One possibility is that there has been a significant increase in the bargaining power of founders of early-stage companies. As described in previous issues of The Entrepreneurs Report, pre-money valuations of companies engaging in their first equity financing have risen sharply in recent years. As participation rights clearly come at the expense of founders and employees who hold common stock and options for common stock, the decline in participation rights also may reflect increased founder bargaining power. Another possibility, suggested by anecdotal evidence, is that Series A investors are dependent on the efforts of the founders for a longer period than other investors, and therefore have a great interest in maintaining founders' motivation by allocating more of the economics of a future outcome to common stock. Nonetheless, another more powerful reason may be behind the shift to non-participating preferred stock—a reason that can be found not on the side of the founders, but on the side of the Series A investors. We believe that in many cases, it is actually in the best interest of early investors, as well as founders, to choose non-participating preferred. We will discuss this in more detail in Part 2 of this article, but the foundation for this argument is the point above: that the Series A investment terms set the DNA for all later rounds of financing by the company. While Series A investors may, in theory, realize greater returns with participating preferred vis-àvis common stockholders, these gains are more than offset by the lower returns they will receive in later series having the same participation rights. Thus, by choosing their deal terms carefully, early-stage investors significantly can shift the allocation of later outcomes for the company in their favor.
1Part 2 will be published in the Q3 2014 Entrepreneurs Report. Trends in High Pre-money Valuation Financings By Jordan Coleman, Associate, Palo Alto The advent of cloud computing, open source software, and other technological advances has enabled start-ups to become increasingly capital efficient. When coupled with growing global market opportunities and customer bases, this new capital efficiency has allowed more successful companies to scale their businesses early in their development without the need for a large influx of growth capital. As a result, successful VC-backed companies are able to remain private for longer periods and delay going public, with the average number of years from first financing to IPO increasing from 3.1 years in 2000 to 7.4 years in 2013, according to the National Venture Capital Association (NVCA) 2014 Yearbook. For example, Twitter and Facebook recently went public with market capitalizations of more than $18 billion and $104 billion, respectively, whereas Amazon, which went public in 1997, had a market capitalization of less than $500 million. This trend, among others, has led to more traditional public investors such as hedge funds and private equity funds, as well as corporate venture capital entrants such as Google, making stronger inroads into the world of private financings. Competition from these new market entrants, along with the greater maturity of successful companies, has led to an increase in both the valuations and frequency of later-stage financings. Specifically, while the total number of venture financings has decreased from Q2 2013 as compared with Q2 2014, the total dollar amount invested has increased. In addition, the total amount of capital invested in U.S. start-ups increased by approximately 75% in the second quarter of 2014 compared with the same period in 2013 despite a reduction of almost 20% in the total number of deals closed during the same period, according to PitchBook's 3Q 2014 U.S. Venture Industry Report. Furthermore, PitchBook reports that total late-stage investment topped $11 billion in the second quarter of 2014, with median pre-money valuations for Series D or later financing rounds increasing from approximately $48 million in 2009 to more than $190 million in the first half of 2014. We have reviewed the terms of venture financings since 2012 with pre-money valuations of $500 million+ and $750 million+ in which Wilson Sonsini Goodrich & Rosati represented either the company or investors. Our analysis of such deals has illustrated certain trends with respect to liquidation preferences, participation rights, redemption rights, and other key deal terms when compared with all Series C and later financing rounds with pre-money valuations of less than $500 million during the same period. The following are some observations based on our survey:
As reported by PitchBook in its 3Q 2014 U.S. Venture Industry Report, later-stage financing activity increased 16% in Q2 as compared with Q1, with total late-stage investments of over $11 billion in Q2, highlighted by a $1.2 billion financing for Uber, a $520 million financing for Airbnb, a $250 million financing for Lyft, and a $200 million financing for Pinterest. Given the increasing prevalence of high pre-money valuations in late-stage financings, it is important for both investors and companies alike to keep these trends in mind in negotiations over downside protections. Comparison of Deal Terms (WSGR Deals)1
1We based this analysis on deals having an initial closing in the period to ensure that the data clearly reflects current trends. Please note that the numbers do not always add up to 100% due to rounding.
This communication is provided as a service to our clients and friends and is for informational purposes only. It is not intended to create an attorney-client relationship or constitute an advertisement, a solicitation, or professional advice as to any particular situation.. © 2014 Wilson Sonsini Goodrich & Rosati, Professional Corporation Click here for a printable version of The Entrepreneurs Report |
|||||||||||||||||||||||||||||||||||||||||||||||||||||||||||||||||||||||||||||||||||||||||||||||||||||||||||||||||||||||||||||||||||||||||||||||||||||||||||||||||||||||||||||||||||||||||||||||||||||||||||||||||||||||||||||||||||||||||||||||||||||||||||||||||||||||||||||||||||||||||||||||||||||||||||||||||||||||||||||||||||||||||||||||||||||||||||||||||||||||||||||||||||||||||||||||||||||||||||||||||||||||||||||||||||||||||||||||||||||||||||||||||||||||||||||||||||||||||||||||||||||||||||||||||||||||||||||||||||||||||||||||||||||||||||||||||||||||||||||||||||||||||||||||||||||||||||||||||||||||||||||||||||||||||||||||||||||||||||||||||||||||
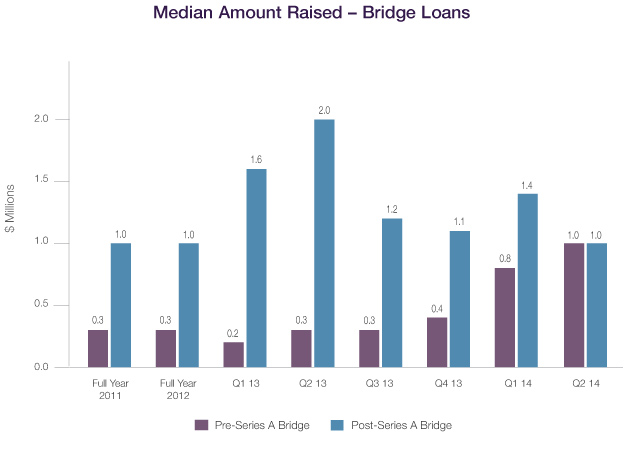 The median amount raised in pre-Series A bridge financings continued to rise, from $0.3 million in 2013 to $0.8 million in Q1 2014 to $1.0 million in Q2 2014. Post-Series A loans continued to move in the other direction, from $1.5 million in 2013 to $1.4 million in Q1 2014 to $1.0 million in Q2 2014.
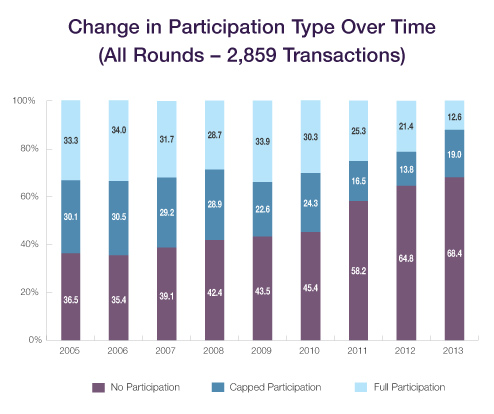 The second situation—in which the postpreference allocation is made exclusively to the common stockholders—is called "no participation." Here, the preferred stockholders may still end up participating in the distribution of the value created beyond invested capital, but only in some cases, and then only at the cost of giving up their liquidation preference. In a no-participation outcome where the post-preference proceeds are small, those proceeds will indeed go solely to the common stockholders, while the preferred stockholders will stand on their liquidation preference. But in noparticipation situations where the post-preference proceeds are such that the common stockholders will receive more on a per share basis than the amount of the preferred stockholders' liquidation preference, the latter will take advantage of their voluntary conversion rights and convert their preferred stock to common so that they can receive the larger common amount per share.
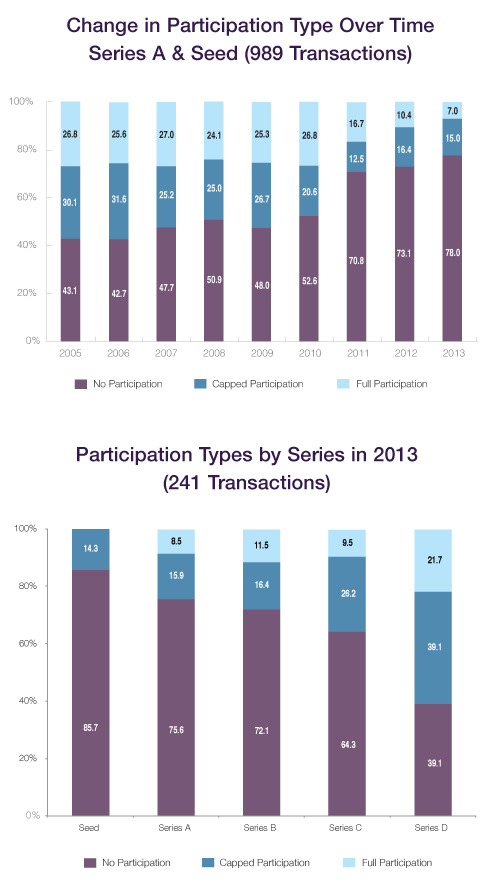 For many years, especially those leading up to and during the Internet bubble, there was fairly little negotiation of participation rights, with an apparent consensus that capped participation was a reasonable compromise and one that didn't require much discussion or analysis.