Summer 2010 From the WSGR Database: Financing Trends for the Second Quarter of 2010 The second quarter of 2010 saw continued improvement in the venture financing environment, as demonstrated by positive trends in a number of deal metrics. While there was only a slight increase in the number of financings during the second quarter of 2010 as compared with the first, there was a fairly significant increase in the dollar amounts invested. Much of the increase in amounts invested was driven by an increase in funding dollars in Series C and later rounds. In addition, there is a favorable trend in valuations, particularly for Series B and later rounds, as the percentage of transactions valued as up rounds increased to 60%, the highest level over the last 18 months, and the median valuations of later-stage investments increased over the prior quarter.
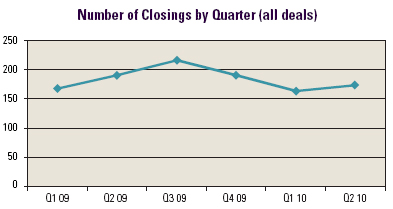
Key Factors First, there has been an increase in exit activity, particularly in the IPO market. According to Dow Jones VentureSource, during the second quarter of 2010, 15 IPOs by venture-backed companies raised $899 million, up from three offerings that raised $232 million in the same period last year and up from eight offerings that raised $711 million during the first quarter of 2010. Further, while the M&A market has been relatively flat when comparing the number of deals in the first half of 2010 with the same period in 2009, the aggregate proceeds generated from these transactions during the first half of 2010 has increased considerably. Indeed, the exit markets overall have not seen these levels since 2007. As a result, investors generally have better visibility into exits, which tends to mitigate their investment risk. Moreover, as the IPO market opens, investors will be more inclined to invest in sectors where there aren’t significant M&A exit options in the form of large strategic acquirors. Further, as their portfolio companies exit, venture capitalists are able to focus on new investments, and as the returns on those investments improve, their limited partners may be more inclined to reinvest the cash generated by those exits in new venture funds. Consequently, an increase in exit market activity is generally expected to drive an increase in venture investment activity, which correlates to our data for the second quarter. Next, an improving economy, coupled with an increase in exit transactions, has contributed to an increase in valuations for non-Series A financings. As the exit markets improve, the corresponding increase in venture investment activity can lead to more competition for deals among investors, which also can result in higher valuations. Furthermore, investors are deploying more dollars into more mature companies, which are benefiting from an improving economy and an increase in capital budgets. With the improvement in the exit markets, these companies may have shorter investment horizons and increased visibility as to exits, which generally support higher valuations. Finally, certain sectors continue to see fairly dramatic growth in venture capital investing. Relatively capital-intensive sectors, such as life sciences as well as clean technology and renewable energy, have seen a continued increased focus from venture investors. This has contributed to an increase in the median and average deal sizes for post-Series A financings, and has helped drive an overall increase in venture dollars invested. Venture Financing Data The number of transactions, counting all closings, was 173 for the second quarter of 2010, compared with 163 for the first quarter of 2010, and 191 for the second quarter of 2009. For the first half of 2010, there were 336 closings, compared with 359 for the first half of 2009. This data suggests that the deal volume has stabilized after a spike in the second through fourth quarters of 2009, which followed a significant decline in venture activity as a result of the economic and financial turmoil that started in the second half of 2008.
While this year the number of deals has been relatively stable from the first quarter to the second, the amounts invested in the second quarter increased sharply over the first quarter, from $998 million to $1,600 million, an increase of 60%. This suggests that average transaction sizes are increasing quarter to quarter. Even excluding single transactions in excess of $100 million (mega deals), the amount invested for the second quarter increased over the first quarter from $998 million to $1,205 million, an increase of 21%. The second quarter of 2010 was the first time since the third quarter of 2009 in which a mega deal was closed.
As for deal size, the median amount raised in closings for Series A rounds during the second quarter of 2010 was $2.0 million, compared with $2.6 million in the first quarter of 2010. However, the median amount raised in closings for Series B rounds increased in the second quarter of 2010 to $5.0 million, compared with $4.1 million in the first quarter. Similarly, for closings in Series C and later rounds, the median amount raised per financing increased in the second quarter of 2010 to $11.5 million, from $9.3 million.1
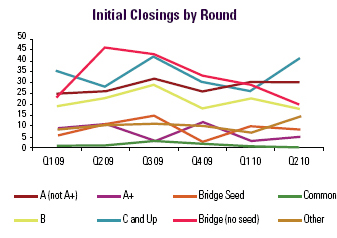
The data also indicates an increased focus on later-stage fundings by investors. Indeed, the number of initial closings for Series C and later rounds increased dramatically in the second quarter of 2010 to 41, compared with 26 in the first quarter. Conversely, the number of initial closings for seed loans and Series A rounds has been relatively stable, while the initial closings for bridge rounds (excluding seed investments) have declined precipitously since the second quarter of 2009.
Significant Financing Terms The table below summarizes data related to certain deal terms that are used in venture funding transactions. For all rounds, there has been a slight increase over the last several years in the percentage of financing rounds where the liquidation preference was senior to earlier rounds, and a slight decrease in the use of liquidation preferences with participation features. The use of weighted-average anti-dilution protection, as opposed to full ratchet, has remained fairly consistent over the same period. The percentage of transactions including a pay-to-play feature has decreased in the first half of 2010 when compared with 2009, but is still higher than it was in 2008. As you would expect, there are distinctions in the terms when comparing down rounds and up rounds. For instance, you are more likely to see senior liquidation preferences with participation features in a down round. Traditionally, a liquidation preference provides investors with some down-side protection upon exit. In the case of a down round, investors tend to focus more on this risk, and structure a liquidation preference that not only gives them the down-side protection (by assuring that their investment is senior to previously invested money), but also allows for some share of the up side (in the form of the participation feature). Further, a down-round investment may indicate a lack of competition for a deal, which can translate into more investor-friendly terms. For the first half of 2010, 68% of the down rounds included senior liquidation preferences, compared with 37% of the up rounds. Similarly, for the first half of 2010, 66% of the down rounds included some liquidation participation feature, while only 46% of the up rounds included participation. In addition, pay-to-play provisions are far more prevalent in down rounds. These provisions are meant to encourage existing investors to participate in a new funding round by imposing disincentives (such as a loss of rights, preferences, or privileges) for a failure to participate. These provisions are more common in down rounds because investors putting in new money in such rounds will want the other investors to take on a proportionate share of the new investment. During the first half of 2010, 20% of the down-round financings included a pay-to-play provision, while only 5% of the up rounds during that period included such a provision. To see how the terms tracked in the table below might be used in the context of a financing, we encourage you to draft a term sheet using our automated Term Sheet Generator. You'll find a link in the Entrepreneurial Services section of wsgr.com, along with information about the wide variety of services Wilson Sonsini Goodrich & Rosati offers to entrepreneurs and early-stage companies.
Private Company Financing Trends (WSGR Deals)2
Editorial Staff: Derek Willis, editor-in-chief (Austin); Mark Baudler (Palo Alto); Doug Collom (Palo Alto); Herb Fockler (Palo Alto); Craig Sherman (Seattle); and Yokum Taku (Palo Alto) Knowledge Management Staff: Eric Little and Heather Crowell
This communication is provided for your information only and is not intended to constitute professional advice as to any particular situation. Please note that the opinions expressed in this newsletter are the authors' and do not necessarily reflect the views of the firm or other Wilson Sonsini Goodrich & Rosati attorneys. © 2010 Wilson Sonsini Goodrich & Rosati, Professional Corporation Click here for a printable version of The Entrepreneurs Report |
||||||||||||||||||||||||||||||||||||||||||||||||||||||||||||||||||||||||||||||||||||||||||||||||||||||||||||||||||||||||||||||||||||||||||||||||||||||||||||||||||||||||||||||||||||||||||||||||||||||||||||||||||||||||||||||||||||||||
 Despite the stability in the number of overall deals, several sectors in particular experienced increases in the number of deals in the second quarter when compared with the first quarter. These sectors include the three largest sectors for venture investing in WSGR’s dataset: life sciences, software, and clean technology and renewable energy. Market data from other sources confirms this trend, as these sectors continue to attract the most attention and investment from the venture community. Overall, investments in the semiconductor and electronics and computer hardware space continue to decline.
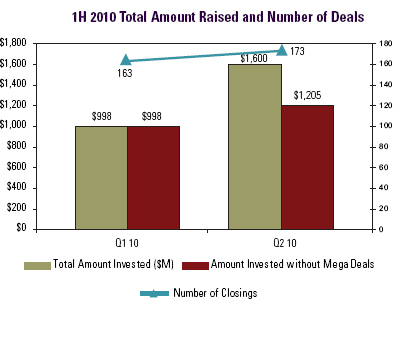 Encouragingly, we continue to see an increase in the number of up rounds, or financings at a valuation that is higher than the last-round valuation. Of the venture financings during the second quarter of 2010, 62% were up rounds, compared with 50% in the first quarter of 2010. There was a corresponding decrease in down rounds as a percentage of all venture financings from 43% in the first quarter of 2010 to 30% in the second, which reflects a trend that began after the third quarter of 2009, as the number of down rounds during that period fell from 50% to 18%. This data indicates a continued strengthening in valuations, largely as a result of increased investment activity and improvement in overall economic conditions, and is one of the more significant trends we are seeing in the market.
 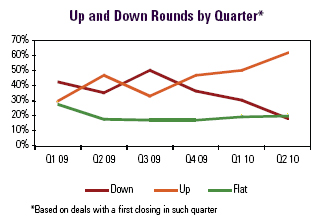 An examination of the median pre-money valuations by round gives us additional insight into the extent of this trend of improving valuations. The median pre-money valuation for Series A financings was $4.1 million for the second quarter of 2010, which is relatively unchanged compared with the $4.0 million for the first quarter of 2010. However, the median pre-money valuation for Series B financings increased to $20.0 million in the second quarter of 2010, compared with $16.7 million in the first quarter, an increase of 20%. Further, the median pre-money valuations for Series C and later financings increased to $58.4 million in the second quarter of 2010 from $47.5 million in the first quarter of 2010, an increase of 23%.
 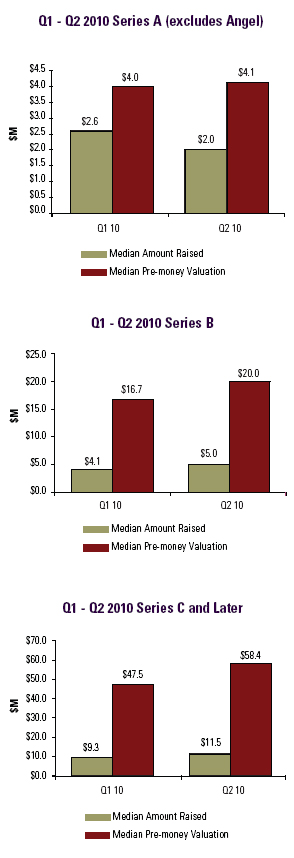 Therefore, while the valuations and deal sizes for early-stage companies are generally flat, later-stage, more mature companies are obtaining higher valuations and more investment dollars as the economy and the exit markets improve and venture activity remains stable.