|
From the WSGR Database: Financing Trends for 2017
For purposes of the statistics and
charts in this report, our database
includes venture financing
transactions in which Wilson
Sonsini Goodrich & Rosati
represented either the company or
one or more of the investors.
|
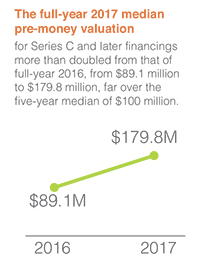
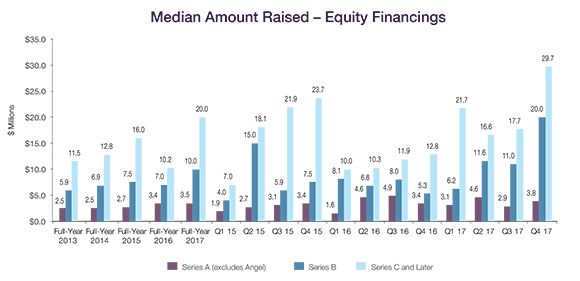
The strong venture financing market of 2017 continued in Q4, resulting in a record-breaking year for median valuations and amounts raised in Series B and later financings. Median pre-money valuations for full-year 2017 Series B financings exceeded those of the past five years. Series C and later median pre-money valuations also reached an all-time high of $179.8 million in full-year 2017—twice the median pre-money valuation reported in full-year 2016. Strong pre-money valuations accompanied high median amounts raised across all rounds of financing in full-year 2017, topping the prior five years. High pre-money valuations also boosted the percentage of up rounds to 85% of all Series B and later financings for full-year 2017.
 Up and Down Rounds Up and Down Rounds
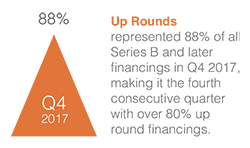
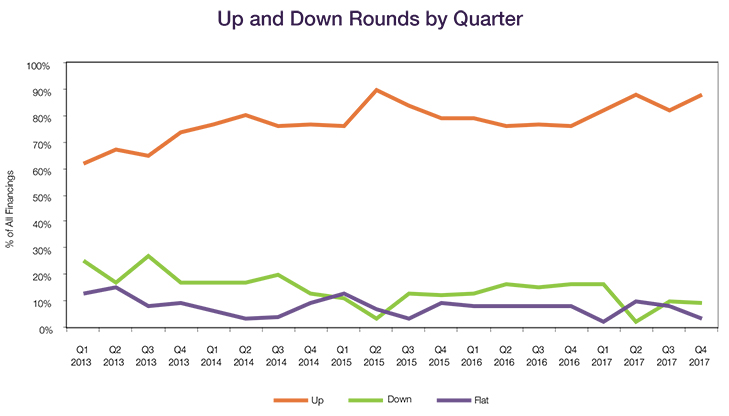
Up rounds represented 88% of all Series B and later financings in Q4 2017, making it the fourth consecutive quarter with over 80% up round financings. Up rounds represented 85% of financings in full-year 2017, a significant increase from the 77% figure in full-year 2016, and surpassing the prior record high of 83% for full-year 2015. Down rounds decreased slightly, from 10% in Q3 2017 to 9% in Q4 2017, while flat rounds saw a more significant decrease, from 8% to 3%. For full-year 2017, down rounds represented 9% and flat rounds represented 6% of financings, as compared to 15% and 8%, respectively, in full-year 2016.
 Valuations
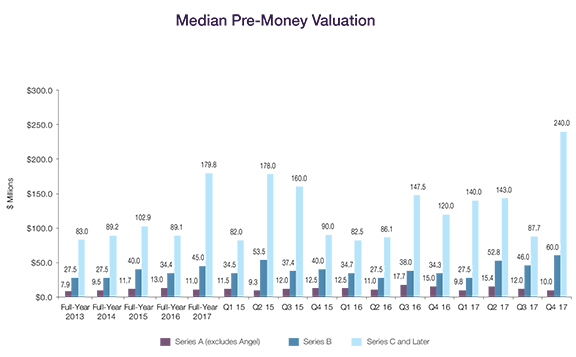
The median pre-money valuation for Seed and Series A rounds slipped slightly in Q4 2017, to $10.0 million from $12.0 million in Q3. The full-year 2017 median valuation for Seed and Series A rounds was also lower than the prior year, falling from $13.0 million in 2016 to $11.0 million in 2017—but still above the five-year median of $10.5 million.
 The median pre-money valuation for Series B rounds reached a historic high of $60.0 million in Q4 2017, up from $46.0 million in Q3. The full-year 2017 median pre-money valuation for Series B rounds also exceeded those of prior years, reaching $45.0 million—well above the five-year median of $35.9 million. The median pre-money valuation for Series B rounds reached a historic high of $60.0 million in Q4 2017, up from $46.0 million in Q3. The full-year 2017 median pre-money valuation for Series B rounds also exceeded those of prior years, reaching $45.0 million—well above the five-year median of $35.9 million.
Late-stage valuations were historically high in 2017. At $240.0 million, the Q4 2017 median pre-money valuation for Series C and later financings was the highest quarterly figure in the past five years, far exceeding the prior high of $178.0 million in Q2 2015. The full-year 2017 median pre-money valuation for Series C and later financings more than doubled from that of full-year 2016, from $89.1 million to $179.8 million, far over the five-year median of $100.0 million. Strong pre-money valuations throughout 2017 and an above-average number of unicorn deals led to a record-breaking year for late-stage financings.
 Amounts Raised Amounts Raised
Full-year 2017 amounts raised were higher than any others in the past five years, across all rounds of funding. Amounts raised in 2017 Series A and Seed transactions increased slightly in Q4 2017, rising from a median of $2.9 million in Q3 to a median of $3.8 million in Q4 2017. The full-year 2017 Seed and Series A median amount raised slightly topped that of the prior year, increasing from $3.4 million in 2016 to $3.5 million in 2017, the highest median of the past five years, though not significantly higher than the five-year median of $3.0 million.
The median amount raised in Q4 2017 Series B financings was nearly double that of the prior quarter, jumping from $11.0 million in Q3 to $20.0 million in Q4. The full-year 2017 Series B median amount raised was $10.0 million, above the five-year median of $6.9 million and nearly matching the full-year 2016 median amount raised for Series C and later rounds.
The median amount raised in Series C and later transactions rose to $29.7 million in Q4 2017, representing the highest quarterly median in five years. The full-year 2017 median for Series C and later transactions was nearly twice that of 2016, jumping from $10.2 million in 2016 to $20.0 million in 2017, and outpacing the five-year median of $14.0 million.
Deal Terms - Preferred
The use of senior liquidation preferences decreased modestly in Series B and later rounds, from 38% of all such rounds in 2016 to 35% in 2017. Senior liquidation preferences in up rounds dipped from 36% in 2016 to 31% in 2017, but their use in down rounds jumped significantly, from 41% in 2016 to 63% in 2017. Pari passu liquidation preferences in up rounds increased from 62% in 2016 to 66% in 2017, but fell in down rounds, decreasing from 45% in 2016 to 38% in 2017.
The percentage of financings having a liquidation preference with participation fell slightly across all financings, slipping from 20% in 2016 to 16% in 2017. However, the proportion of down rounds with participating liquidation preferences nearly doubled from 26% in 2016, to 50% in 2017.
Investors received broad-based weighted average anti-dilution protection in 94% of all deals in 2017, slightly more than the 92% figure in 2016, with increases year-over-year in both up and down rounds. The use of narrow-based weighted average anti-dilution protection remained quite low at 2%, up one percentage point from 2016. The percentage of deals having redemption rights increased from 13% in 2016 to 19% in 2017, and more of those were mandatory, up from 2% of all deals in 2016 to 7% in 2017.
Data on deal terms such as liquidation preferences, dividends, and others are set forth in the table below. To see how the terms tracked in the table can be used in the context of a financing, we encourage you to draft a term sheet using our automated Term Sheet Generator, which is available in the Start-Ups and Venture Capital section of the firms website at www.wsgr.com.
Private Company Financing Deal Terms (WSGR Deals)1
|
2013 |
2014 |
2015 |
2016 |
2017 |
2013 |
2014 |
2015 |
2016 |
2017 |
2013 |
2014 |
2015 |
2016 |
2017 |
All Rounds2 |
All Rounds2 |
All Rounds2 |
All Rounds2 |
All Rounds2 |
Up Rounds3 |
Up Rounds3 |
Up Rounds3 |
Up Rounds3 |
Up Rounds3 |
Down Rounds3 |
Down Rounds3 |
Down Rounds3 |
Down Rounds3 |
Down Rounds3 |
Liquidation Preferences - Series B and Later |
Senior |
41% |
40% |
33% |
38% |
35% |
38% |
32% |
31% |
36% |
31% |
47% |
68% |
35% |
41% |
63% |
Pari Passu with Other Preferred |
55% |
56% |
62% |
57% |
62% |
60% |
64% |
66% |
62% |
66% |
37% |
21% |
53% |
45% |
38% |
Junior |
0% |
0% |
1% |
1% |
0% |
0% |
0% |
1% |
0% |
0% |
0% |
0% |
0% |
5% |
0% |
Complex |
3% |
2% |
3% |
4% |
3% |
2% |
2% |
1% |
2% |
4% |
11% |
5% |
12% |
9% |
0% |
Not Applicable |
1% |
3% |
1% |
0% |
0% |
0% |
2% |
1% |
0% |
0% |
5% |
5% |
0% |
0% |
0% |
Participating vs. Non-participating |
Participating - Cap |
18% |
12% |
8% |
9% |
6% |
20% |
14% |
11% |
10% |
7% |
23% |
13% |
12% |
22% |
31% |
Participating - No Cap |
12% |
14% |
11% |
11% |
10% |
10% |
11% |
12% |
13% |
11% |
30% |
32% |
35% |
4% |
19% |
Non-participating |
70% |
74% |
81% |
81% |
84% |
69% |
76% |
77% |
77% |
82% |
48% |
55% |
53% |
74% |
50% |
Dividends |
Yes, Cumulative |
12% |
13% |
3% |
6% |
7% |
12% |
11% |
3% |
7% |
9% |
13% |
24% |
24% |
22% |
13% |
Yes, Non-cumulative |
74% |
72% |
82% |
73% |
78% |
79% |
74% |
86% |
78% |
78% |
79% |
71% |
76% |
70% |
81% |
None |
14% |
15% |
15% |
21% |
16% |
9% |
15% |
11% |
15% |
13% |
8% |
5% |
0% |
9% |
6% |
Anti-dilution Provisions |
Weighted Average - Broad |
90% |
85% |
80% |
92% |
94% |
94% |
90% |
86% |
92% |
96% |
95% |
92% |
75% |
91% |
100% |
Weighted Average - Narrow |
3% |
9% |
13% |
1% |
2% |
3% |
6% |
12% |
1% |
1% |
0% |
5% |
19% |
0% |
0% |
Ratchet |
1% |
1% |
1% |
1% |
0% |
0% |
1% |
1% |
2% |
0% |
3% |
0% |
0% |
0% |
0% |
Other (Including Blend) |
1% |
1% |
1% |
3% |
1% |
1% |
1% |
1% |
3% |
1% |
0% |
0% |
0% |
9% |
0% |
None |
5% |
4% |
5% |
3% |
3% |
2% |
2% |
1% |
2% |
1% |
3% |
3% |
6% |
0% |
0% |
Pay to Play - Series B and Later |
Applicable to This Financing |
5% |
4% |
5% |
5% |
2% |
1% |
1% |
3% |
3% |
2% |
15% |
16% |
18% |
9% |
6% |
Applicable to Future Financings |
1% |
0% |
1% |
1% |
0% |
1% |
0% |
0% |
1% |
0% |
0% |
0% |
12% |
0% |
0% |
None |
95% |
96% |
94% |
94% |
98% |
98% |
99% |
97% |
96% |
98% |
85% |
84% |
71% |
91% |
94% |
Redemption |
Investor Option |
19% |
17% |
13% |
11% |
12% |
20% |
22% |
19% |
20% |
19% |
33% |
24% |
12% |
9% |
20% |
Mandatory |
1% |
3% |
2% |
2% |
7% |
2% |
3% |
3% |
3% |
9% |
0% |
3% |
0% |
0% |
0% |
None |
80% |
80% |
85% |
87% |
81% |
78% |
75% |
78% |
77% |
72% |
67% |
74% |
88% |
91% |
80% |
| 1 We based this analysis on deals having an initial closing in the period to ensure that the data clearly reflects current trends. Please note the numbers do not always add up to 100% due to rounding. |
| 2 Includes flat rounds and, unless otherwise indicated, Series A rounds. |
| 3 Note that the All Rounds metrics include flat rounds and, in certain cases Series A financings as well. Consequently, metrics in the All Rounds column may be outside the ranges bounded by the Up Rounds and Down Rounds columns, which will not include such transactions. |
| |
Bridge Loans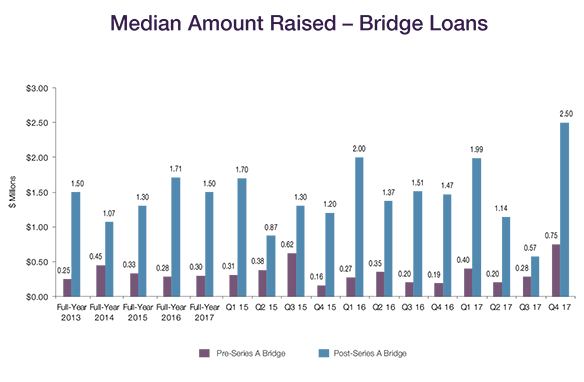
The median amount raised in pre-Series A bridge loans jumped significantly in Q4 2017, from $0.28 million in Q3 to $0.75 million in Q4. The full-year median amount raised was $0.30 million, slightly more than in 2016 but less than in 2015 and 2014. The median amount raised for Q4 2017 post-Series A bridge loans spiked from the Q3 record-low median of $0.57 million to $2.50 million, higher than any quarter in the past five years. However, at $1.50 million, the full-year 2017 median amount raised for post-Series A bridge loans did not beat the 2016 record-high full-year median of $1.71 million.
Deal Terms – Bridge Loans
Bridge loan interest rates for pre-Series A deals remained low in 2017. Among pre-Series A bridge loans, 75% had interest rates less than 8%, down just one percentage point from 2016. However, the number of pre-Series A bridge loans with interest rates greater than 8% increased to 8% in 2017, slightly more than was seen in the prior three years.
Interest rates remained steady for post-Series A bridge loans in 2017, with just 17% of post-Series A bridge loans having an interest rate above 8%, the same as in 2016, while 56% of such loans bore rates of less than 8%, slightly more than in 2016. In addition, the percentage of loans with maturity periods of less than 12 months increased for both pre- and post-Series A financings, from 17% in 2016 to 22% in 2017 for pre-Series A financings, and from 29% to 41% for post-Series A financings, reflecting the trend toward shorter term, higher-interest loans.
More pre-Series A bridge loans were subordinated to other debt in 2017, increasing from 20% in 2016 to 28% in 2017. On the other hand, post-Series A loans subordinated to other debt declined from 45% in 2016 to 33% in 2017. Of the 16% of post-Series A bridge financings that had warrants in 2017, 60% also had a discount on conversion into equity, up significantly from 2016, when 33% of post-Series A bridge financings that had warrants also had a discount on conversion.
The number of pre-Series A bridge loans that were convertible to equity at a discounted price increased from 82% in 2016 to 89% in 2017, and 84% of those that were convertible at a discount received a discount rate of 20% or more on conversion. Similarly, the number of post-Series A bridge loans that were convertible to equity at a discounted price rose from 74% in 2016 to 76% in 2017, with 80% of those receiving a discount rate of 20% or more on conversion.
We recently started tracking whether convertible note conversion was automatic or voluntary, the dollar thresholds for conversion, and the conversion price cap amounts. Of the 2017 post-Series A convertible bridges, 93% had automatic conversion and 7% had voluntary conversion, as compared to 2016, in which 97% had automatic conversion and 3% had voluntary conversion.
The 2017 median dollar thresholds for a qualified financing in pre- and post-Series A bridges were $2 million and $10 million, respectively, as compared to $1 million and $5 million, respectively, in 2016. The 2017 median conversion price caps in pre- and post-Series A bridges were $10 million and $25 million, respectively, relatively unchanged from 2016, which had median price caps of $6 million and $25 million, respectively.
Bridge Loans Deal Terms (WSGR Deals)1
Bridge Loans |
2013
Pre-Series
A |
2014
Pre-Series
A |
2015
Pre-Series
A |
2016
Pre-Series
A |
2017
Pre-Series
A |
2013
Post-Series
A |
2014
Post-Series
A |
2015
Post-Series
A |
2016
Post-Series
A |
2017
Post-Series
A |
Interest rate less than 8% |
70% |
72% |
74% |
76% |
75% |
46% |
43% |
54% |
52% |
56% |
Interest rate at 8% |
29% |
22% |
19% |
19% |
17% |
34% |
42% |
33% |
30% |
27% |
Interest rate greater than 8% |
1% |
6% |
7% |
5% |
8% |
20% |
15% |
13% |
17% |
17% |
Maturity less than 12 months |
3% |
12% |
17% |
17% |
22% |
29% |
24% |
34% |
29% |
41% |
Maturity at 12 months |
19% |
16% |
9% |
5% |
8% |
38% |
39% |
8% |
23% |
19% |
Maturity more than 12 months |
78% |
71% |
74% |
78% |
69% |
33% |
37% |
58% |
49% |
41% |
Debt is subordinated to other debt |
25% |
22% |
15% |
20% |
28% |
56% |
48% |
38% |
45% |
33% |
Loan includes warrants2 |
4% |
5% |
3% |
8% |
0% |
34% |
19% |
25% |
17% |
16% |
Warrant coverage less than 25% |
0% |
20% |
100% |
80% |
N/A |
50% |
69% |
47% |
23% |
43% |
Warrant coverage at 25% |
0% |
0% |
0% |
0% |
N/A |
12% |
0% |
7% |
15% |
14% |
Warrant coverage greater than 25% |
100% |
80% |
0% |
20% |
N/A |
38% |
31% |
47% |
62% |
43% |
Principal is convertible into equity3 |
100% |
98% |
93% |
97% |
97% |
94% |
94% |
86% |
92% |
92% |
Conversion rate subject to price cap4 |
68% |
67% |
64% |
79% |
74% |
14% |
23% |
26% |
29% |
34% |
Conversion to equity at discounted price5 |
91% |
81% |
78% |
82% |
89% |
59% |
73% |
71% |
74% |
76% |
Discount on conversion less than 20% |
17% |
10% |
11% |
12% |
16% |
16% |
25% |
25% |
25% |
20% |
Discount on conversion at 20% |
60% |
72% |
73% |
76% |
74% |
46% |
44% |
47% |
49% |
50% |
Discount on conversion greater than 20% |
22% |
17% |
16% |
12% |
10% |
38% |
32% |
27% |
26% |
30% |
Conversion to equity at same price as other investors |
9% |
16% |
18% |
13% |
3% |
35% |
24% |
25% |
19% |
24% |
1 We based this analysis on deals having an initial closing in the period to ensure that the data clearly reflects current trends. Please note the numbers do not always add up to 100% due to rounding.
2 Of the 2013 post-Series A bridges with warrants, 24% also had a discount on conversion into equity. Of the 2014 post-Series A bridges with warrants, 38% also had a discount on conversion into equity. Of the 2015 post-Series A bridges with warrants, 58% also had a discount on conversion into equity. Of the 2016 post-Series A bridges with warrants, 33% also had a discount on conversion into equity. Of the 2017 post-Series A bridges with warrants, 60% also had a discount on conversion into equity.
3 Of the 2016 pre-Series A convertible bridges, 93% had automatic conversion and 7% had voluntary conversion. Of the 2017 pre-Series A convertible bridges, 94% had automatic conversion and 6% had voluntary conversion. Of the 2016 post-Series A convertible bridges, 97% had automatic conversion and 3% had voluntary conversion. Of the 2017 post-Series A convertible bridges, 93% had automatic conversion and 7% had voluntary conversion. The 2016 median dollar threshold for a qualified financing in pre- and post-Series A bridges was $1M and $5M, respectively. The 2017 median dollar threshold for a qualified financing in pre- and post-Series A bridges was $2M and $10M, respectively
4 The 2016 median price cap in pre- and post-Series A bridges was $6M and $25M, respectively. The 2017 median price cap in pre- and post-Series A bridges was $10M and $25M, respectively.
5 Of the 2013 post-Series A bridges that had a discount on conversion into equity, 15% also had warrants. Of the 2014 post-Series A bridges that had a discount on conversion into equity, 10% also had warrants. Of the 2015 post-Series A bridges that had a discount on conversion into equity, 21% also had warrants. Of the 2016 post-Series A bridges that had a discount on conversion into equity, 8% also had warrants. Of the 2017 post-Series A bridges that had a discount on conversion into equity, 13% also had warrants.
|
[back to top]
Three Areas of Focus to Prepare for a Successful IPO in 2018
By Andrew Ellis and Philip Oettinger
Editorial note: This article is based on a previously published work that emphasized information relevant to life sciences companies. If you would like to review that article, you can access it here.
Globally, 2017 was the biggest year for IPOs since 2007, both in terms of the number of deals (1,624 IPOs) and proceeds raised ($188.8 billion), with 49 percent and 40 percent increases, respectively, compared with 2016. In the United States, there were 174 IPOs raising $39.5 billion in 2017, which is an increase of 55 percent in volume and 84 percent in proceeds raised compared to 2016.1
Completing an IPO is an enormous milestone for any company. Along with the excitement, liquidity, and attention, IPOs also bring the responsibility of SEC reporting, increased regulatory burden and tougher public scrutiny. In order to prepare for these additional challenges, there are certain action items, that we advise our clients to undertake before the IPO process begins. As it often takes time to implement these action items we encourage clients to start early. Below are three main areas of focus to prepare for a successful IPO in 2018.
1. Build Up Your Financial and Reporting Team and Resources
The most important part of IPO preparedness is ensuring that you have sufficient internal financial resources.
The chief financial officer (CFO) is the most important member of the finance team and the most important company representative during the IPO process. If you are contemplating an IPO and do not have a CFO with public company experience (or who is up for the challenge of learning on the job), hiring such a CFO should be your highest priority. This is important not only operationally, but also from a marketing perspective, as new investors will be looking for a CFO they can trust to run a companys finance function, and other members of management and the board will be looking to the CFO to make sure the companys financial performance is accurately reflected in order to communicate with investors and limit liability.
Particularly for companies with revenue, your second priority should be to consider hiring a controller, with a strong preference for someone with public company experience. An experienced controller can help ensure that you have the processes in place to meet public company reporting timelines and maintain internal accounting and control standards, which would enable the CFO to focus on higher-level matters. Other hires in the finance department may be necessary depending on the size and complexity of your accounting and finance functions, but these two are the most important.
For larger companies—or to fill a gap in public company experience on your financial team—you may want to consider hiring a Securities and Exchange Commission (SEC) reporting manager. This individual is responsible for coordinating with your legal, accounting, and investor relations teams with respect to quarterly and annual reporting, XBRL, Section 16 filings, and other accounting and reporting matters, which frees up your CFO and/or controller to focus on their respective non-reporting functions on a daily basis.
A third position that can take a lot of lead time to fill is the Audit Committee Chair. Board members with financial experience are in high demand, and it is important to find someone whose style is compatible with the rest of the board. The SEC requires that every public companys audit committee contains at least one audit committee financial expert, and, while it is not necessary that this individual becomes the Audit Committee Chair, it is typically preferable. We often see companies focus on finding their Audit Committee Chair before they even build out the finance management team below the CFO.
As the challenges facing your company grow, both due to internal growth and new regulatory and reporting burdens as a public company, your financial organization may need to upgrade from (in many cases) Microsoft Excel spreadsheets to a more scalable and efficient financial reporting technology solution. As you plan your SEC reporting and accounting processes, you should ask your auditors what they see as standard for a company of your size in your industry.
2. Assemble Your IPO Team
In addition to your internal hiring, you will need to evaluate and eventually choose a large external team to support you through the IPO process and as a public company, which should include:
- Law Firm. Your lawyers will guide you through the IPO process and can make assembling the rest of the external team easier, so you should engage a law firm as early in the process as possible. It is of utmost importance to hire a law firm with significant IPO experience because an experienced IPO lawyer can keep the timeline moving forward by anticipating next steps and can help you avoid numerous potential pitfalls. As a result, it may be time for you to upgrade from your prior counsel. An experienced IPO lawyer will know first-hand what similarly situated companies have done in the various situations you will face.
- Auditors. It is at least as important, if not more important, to identify the right auditors to use for the financial statements in the S-1 and going forward as a public company. The big four audit firms are the obvious choices, but our clients have had good experiences with other audit firms as well. When choosing an auditor (and choosing whether or not your current auditor needs to be replaced), the key is to find one that: (i) your target investors will respect and trust, (ii) has geographical and/or industry expertise, if applicable to you, and (iii) is committed to your timeline. Auditors can also be a tremendous resource for advice on establishing or upgrading your internal controls and processes. Depending on how quickly after the IPO organizational meeting (org meeting) you want to make your confidential submission, you may need to engage your auditors well before you engage any other external team members.
- Underwriters. Depending on your market (or sub-market), your choice of underwriters can have a huge impact on your IPO and subsequent trading. Similar to auditors, you should find underwriters that: (i) have relationships with your target investors to sell the offering, (ii) have analysts who are knowledgeable about the industry in which you operate and can write credible reports, (iii) have geographical and/or industry expertise, (iv) have the financial resources to be able to stabilize trading following the IPO, and (v) are committed to your timeline and share your vision as to how to present the company to potential investors. The analyst coverage provided by the underwriters in your syndicate may make a big difference in the institutional ownership of your stock and the overall market interest in your business and is oftentimes the critical factor in choosing underwriters, especially in life sciences. Another area where it is important to be aligned with your underwriters on is valuation. If your lead underwriter does not share your idea of valuation, you may be setting yourself up for a confrontation later in the process when it is too late to change horses.2
- Stock Exchange. Although it may not seem like it, the stock exchange you choose is a service provider like your lawyer or auditor and is part of your external team. In addition to providing the exchange on which your stock is traded, they can help you by expediting their review when the timeline gets tight and often also commit resources to marketing matters or handle the investor relations portion of your website.3
- Investor Relations. An investor relations firm can help you field questions from investors, issue press releases, revise your website, and comply with various investor information requirements that will be applicable to you when your stock begins trading. In most cases, we recommend that our IPO clients engage an investor relations firm during the IPO process in order to ensure that the firm is onboarded before trading begins.
- Financial Printers. During the IPO process, your financial printer of choice will help assemble and submit your filings and will help process changes that are made to those filings during the IPO process. They also print the preliminary prospectuses that are delivered during your roadshow and the final prospectuses that are delivered once you begin trading. This sounds simple enough, but to keep the machine running smoothly you need to choose an experienced printer that is focused on customer service.
- Other Consultants. Depending on the needs of the company, you may need to engage one or more additional consultants before or during the IPO process. For example, for healthcare and biotech companies with limited finance personnel, it may make sense to hire a financial consultant to help prepare financials and with disclosure in the S-1. If your regulatory path is not yet certain, you may need to hire a regulatory consultant to help ensure your disclosure adequately reflects the risks in your business and matches realistic expectations regarding timeline and categorization. Consultants such as these can be engaged on an ad hoc basis and are not necessary for every company.
3. Create Public Company Infrastructure
Hiring internally and engaging external providers are important parts of the process, but it is just as important for you to gather your internal documentation, evaluate your internal process, and make necessary changes before and during the IPO process. There are many things to consider, but some key items you should address are:
- Policies. Early in the IPO process, you should have your counsel create forms of the various policies you will need in order to operate as a public company, such as communications policies, insider trading policies, committee charters, whistleblower policies, codes of conduct, etc. Although only certain of these are required by rules or regulations, there are several others that are considered best practices and can be an effective defense against any future claims regarding inadequate corporate governance. Review these forms of policies to understand them and think about (i) who would best fill each role within them and (ii) how they will actually be implemented. Take steps toward implementation before the IPO so you are not overwhelmed on the first day of trading. Most importantly, make sure that any policies that are adopted are actually followedit is better not to have a policy at all than to have one and not follow it.
- Financial and Accounting Operations. Leading up to the IPO, start and maintain the processes you will need in order to timely report your financials as a public company. Some clients even hold mock quarterly conference calls and practice closing the books according to accelerated timelines in order to prepare for being a public company. Discuss internal controls, Sarbanes-Oxley (SOX) compliance, and best practices internally and with your auditors. The importance of this is inversely proportional to the level of prior public company experience in your finance and accounting team.
- Executive Compensation. If the company has not already done so, begin obtaining regular quarterly 409A valuations in order to establish the practice and defend the fair value of the equity awards you have granted leading up to the IPO. If equity awards are granted at less than fair value in the 12-18 months prior to an IPO, it may raise a cheap stock issue with the SEC or even worse, cause the SEC to ask whether the board has fulfilled its fiduciary duties to stockholders in pricing options. If the SEC determines that cheap stock was granted, then the company will need to take an accounting charge for the difference between the grant price and the fair value of that equity and in more serious cases it could lead to additional disclosure on option granting practices or delay effectiveness, if the SEC is uncomfortable with the price at which options were granted. Proper valuation at frequent intervals or in conjunction with major events (financings, acquisitions, etc.) on at least a quarterly basis 12-18 months prior to an IPO and adequate disclosure in the S-1 can minimize risk. In addition, make sure that there are no outstanding loans from the company to directors or officers prior to filing the S-1 in order to comply with Sarbanes-Oxley Section 402.
- Documentation. Using a sample diligence request list provided by your counsel, begin compiling your diligence items in a data room (or locally in folders until you engage a data room provider) well in advance of the org meeting. This does two things: (i) it ensures that these documents are already organized and ready to upload when diligence needs to begin and (ii) it can reveal areas of weakness in your prior documentation that you can address before the IPO. Besides material agreements (licenses, manufacturing agreements, and the like), of particular importance are the companys foundational documents and documents related to the issuance of equity or debt.
- Communication. Make sure your external communications (your website, your social media, press releases, etc.) do not contain any statements that you cannot prove or that are not accompanied by appropriate disclaimers. It is important that your website and communications match the statements made in the S-1 in all material respects. Finally, ask your counsel for publicity guidelines that you can review and convey to your employees so they do not run afoul of SEC rules regarding communications during the IPO process.
- Board of Directors. This is not an action item for every company, but you should take some time to evaluate your current board. In order to establish a majority of independent directors or round out your areas of expertise—for example, to add a financial expert to a science-heavy board—it may be in the companys best interest to add to or replace certain of your board members. In some cases, venture capital directors may need to rotate off of the board because their partnerships will not let them sit on public company boards. In other cases, you may have a vestigial early investor on the board, and the IPO is a natural time for them to move on. The CEO should take an active role, working with existing board members, to determine how many directors will be leaving, how many new directors need to be appointed, and the skillsets required by the directors to fill the board and committee roles. These can be difficult conversations to have, and good board members can be difficult to find, so starting early is important.
- Your Story. Before the first line of your S-1 is written, you should have an idea of how you want to tell your story. This will come in part from past presentations to investors, but special care should be given to the addressable market, how you compare to competitors, the unique way you solve an unmet need, discussions you have with underwriters, what key metrics you use to evaluate your performance, and how you intend to use the IPO proceeds.
Conclusion
The mere exercise of preparing for an IPO can be a catalyst for a lot of positive change at a growing company. Many of our clients contemplating an IPO still have startup infrastructures, and major upgrades are necessary in order to operate like a large private company or a public company. Collecting diligence materials can illuminate missing documentation or faulty processes, thinking about accounting disclosure can refine how you recognize revenue, and the act of outlining your business section can refine the way you think about your business. In order to have a smooth IPO and to avoid delays while managing risk, we recommend focusing on these three main areas prior to or early in the IPO process.
We look forward to a robust IPO market in 2018. For more information about any of these areas, or to begin a conversation about your planned IPO, contact Andrew Ellis, Philip Oettinger, or another WSGR attorney.
We also invite you to review WSGRs 2017 Technology and Life Sciences IPO Report, which sets forth data related to 61 IPOs that priced between January 1 and June 30, 2017. The report covers filing characteristics, governance factors, defensive measures, and other variables.
1 http://www.ey.com/Publication/vwLUAssets/ey-global-ipo-trends-q4-2017-de/$FILE/ey-global-ipo-trends-q4-2017.pdf.
2 Sometimes underwriters provide a necessary reality check on valuation, so it may not be an argument that is in your best interest to win. Just make sure you have these conversations early so there are no surprises later in the process.
3 Our clients often reserve a ticker symbol early in the process, but do not submit an application to an exchange until drafting has begun.
[back to top]
Methodology
The Up/Down/Flat analysis is based on WSGR deals having an initial closing in the period reported to ensure that the data clearly reflects current trends. The median pre-money valuation is calculated based on the pre-money valuation given at the time of the initial closing of the round. If the issuer has a closing in a subsequent quarter, the original pre-money valuation is used in the calculation of the median for that quarter as well. A substantial percentage of deals have multiple closings that span fiscal quarters. The median amount raised is calculated based on the aggregate amount raised in the reported quarter. For purposes of this report, Series Seed transactions are included with Series A transactions.
This report is based on detailed deal data provided by the firms corporate and securities attorneys and analyzed by the firms Knowledge Management department.
Healthcare Innovations Venture Investment Forum
On December 6-8, 2017, WSGR held its third Healthcare Innovations Venture Investment Forum in Austin, Texas. The event connected investors with promising life sciences start-ups from a variety of industry sectors, including diagnostics, therapeutics, medical devices, and digital health.
Over the course of three days, more than 150 innovative life sciences companies from across the country met privately with over 50 top-tier life sciences investors. Additionally, during breakfast, lunch, and receptions, companies were able to network with investors and fellow entrepreneurs.
Investment in life sciences is tremendously robust, and great ideas can be well-financed today, said WSGR partner Vern Norviel. This investment environment now creates the opportunity to make enormous advances. Technologies such as immunotherapy, gene editing, cell therapy, and inexpensive DNA sequencing are making changes in patient treatment that were unimaginable a few years ago.
WSGR hosted its first venture forum in Palo Alto, California, in 2016, and a second forum in Boston, Massachusetts, in conjunction with the Harvard Innovation Lab, in Spring 2017. The therapeutics sector made up 40 percent of the more than 370 company submissions to the forum this year, followed by medical devices at 33 percent, and digital health at 26 percent.
For data on deal terms in life sciences venture financings, please see WSGRs Winter 2018 Life Sciences Report.
|
WSGR Ranked No. 1 for 2017 Venture Financings
Dow Jones VentureSource recently ranked Wilson Sonsini Goodrich & Rosati as the leading law firm for U.S. venture financings during the first half of 2017.
Dow Jones VentureSource recently ranked Wilson Sonsini Goodrich & Rosati as the leading law firm for U.S. venture financings in 2017, ahead of all other firms by the total number of rounds of equity financing raised on behalf of clients. WSGR is credited as legal advisor in 205 rounds of financing, while its nearest competitor advised on 158 rounds of financing.
According to VentureSource, WSGR also ranked first for issuer-side U.S. deals in the following industries: electronics and hardware, energy and utilities, healthcare, industrial goods and materials, information technology, medical devices and equipment, and software.
|
To learn more about WSGR's full suite of services for entrepreneurs and early-stage companies, please visit the Start-Ups and Venture Capital section of wsgr.com.
For more information about this report or if you wish to be included on the email subscription list, please email us at EntrepreneursReport@wsgr.com. There is no subscription fee. |
This communication is provided as a service to our clients and friends and is for informational purposes only. It is not intended to create an attorney-client relationship or constitute an advertisement, a solicitation, or professional advice as to any particular situation.
© 2018 Wilson Sonsini Goodrich & Rosati, Professional
Corporation
Click here for a printable version of The Entrepreneurs Report |