
From the WSGR Database: Financing Trends for Full-Year 2013
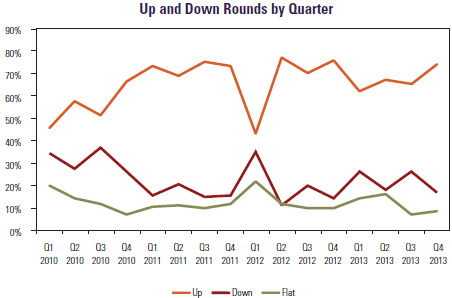
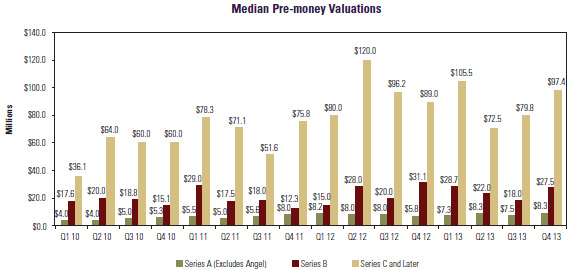
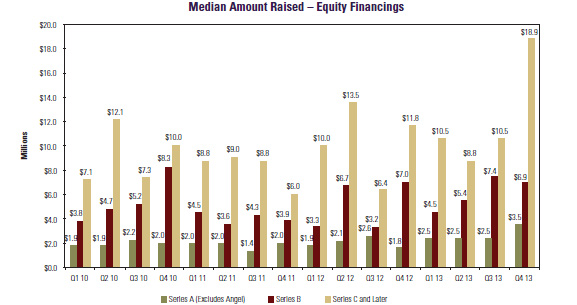
During the fourth quarter of 2013, the number of venture deals dropped slightly, but amounts raised by venture-backed companies continued to be strong. As widely reported, total dollars invested in 2013 were slightly higher than in 2012. An analysis of transactions in which Wilson Sonsini Goodrich & Rosati represented either the company or investors confirms reports that the market remains positive, with up rounds rising to nearly three-quarters of all venture deals in Q4 2013 and comprising 66% of all rounds for the full year. Both median amounts raised and median pre-money valuations rose for most rounds that had closings in Q4 as compared with Q3, in some cases reaching highs not seen in four or more years. Specifically, median amounts raised increased for Series A1 and Series C and later deals that had closings in Q4, whereas median amounts raised for Series B rounds declined. Median pre-money valuations increased for all equity rounds. As discussed in this article, deal terms in 2013 remained broadly comparable to those in 2012. The one exception was that the usage of participation rights continued to decline. 1Seed transactions are included with Series A deals.
Deal Terms Liquidation preferences. Deals with senior liquidation preferences continued to be slightly more prevalent in 2013 than in 2012, rising from 37% of all rounds in 2012 to 41% in 2013. For up rounds, the proportion of financings with senior liquidation preferences rose from 30% in 2012 to 38% in 2013, whereas in down rounds, the use of such preferences actually declined from 56% in 2012 to 47% in 2013. As reported in previous quarters, this decline was offset by a large increase in the use of complex preference structures in down rounds, which rose from 0% of all deals in 2012 to 11% in 2013. Participation rights. The use of participating preferred continued to decrease, from 33% of all deals in 2012 to 30% in 2013. Much of this decline was in up rounds (which comprised the majority of all deals), where usage declined from 33% of all deals in 2012 to 31% in 2013. For down rounds, the decrease in the use of participating preferred was slightly larger, from 58% of all deals in 2012 to 53% in 2013. Dividends. The use of cumulative dividends rose from 9% of all deals in 2012 to 12% in 2013. Anti-dilution provisions. There was a small increase in the use of broad-based weighted-average anti-dilution provisions, from 92% of all rounds in 2012 to 95% in 2013. Pay-to-play provisions. The use of pay-to-play provisions declined in 2013 as compared with 2012, dropping from 8% of all deals to 6%. Redemption. The overall use of redemption provisions also declined slightly, from 23% of deals in 2012 to 20% in 2013. In up rounds, the use of investor-option redemption in deals dropped from 23% in 2012 to 20% in 2013. The use of investor-option redemption in down rounds also dropped slightly, from 35% in 2012 to 33% in 2013. To see how the terms tracked in the table below can be used in the context of a financing, we encourage you to draft a term sheet using our automated Term Sheet Generator. You'll find a link in the Entrepreneurial Services section of the firm's website (www.wsgr.com), along with information about the wide variety of services that Wilson Sonsini Goodrich & Rosati offers to entrepreneurs and early-stage companies.
Private Company Financing Trends (WSGR Deals)1
Bridge Loans
Interest Rates. Data for 2013 confirmed the previously reported trend of generally declining interest rates for pre-Series A bridge loans. However, rates for post-Series A bridge loans were mixed, with rates both above and below 8% increasing. The percentage of pre-Series A bridges with annual rates under 8% increased from 64% of all deals in 2012 to 70% in 2013, and the percentage with rates above 8% declined from 5% of such deals to 1%. By contrast, the percentage of post-Series A bridge loans with annual interest rates above 8% increased from 15% of all deals in 2012 to 20% in 2013, while the percentage of post-Series A bridges with rates of less than 8% also increased slightly, from 44% in 2012 to 46% in 2013. Maturities. Maturities for pre-Series A bridge loans in 2013 remained substantially longer than for post-Series A loans. The percentage of pre-Series A deals with maturities of 12 months or more increased from 92% in 2012 to 97% in 2013. For post-Series A loans, maturities of one year or more increased from 66% of loans in 2012 to 71% in 2013. Subordinated Debt. The use of subordinated debt increased in 2013 for both pre- and post-Series A bridge loans, rising from 13% of pre-Series A loans in 2012 to 25% in 2013, and from 39% of post-Series A loans in 2012 to 56% in 2013. Warrants. Only a small percentage of pre-Series A loans have warrants, so we did not examine trends in warrant coverage for those deals. For post-Series A bridge loans, the use of warrants increased from 32% of all such deals in 2012 to 34% of deals in 2013. In 2012, 33% of the post-Series A deals with warrants had 25% warrant coverage. This percentage declined to 12% in 2013, while deals with more than 25% warrant coverage increased from 14% of deals with warrants in 2012 to 38% of such deals in 2013. Conversion. The percentage of pre-Series A bridge loans subject to an explicit price cap on conversion grew from 65% of deals in 2012 to 68% in 2013; 91% of deals in 2013 were convertible at a discounted price, up substantially from the 79% figure in 2012. Conversely, the percentage of post-Series A bridge loans subject to a price cap fell from 24% in 2012 to 14% in 2013, while the percentage of post-Series A deals convertible at a discounted price increased to 59% of deals in 2013 as compared with 52% in 2012. Multiples. Provision for repayment at a multiple of the loan value in the event of an acquisition increased for pre-Series A loans, from 16% of deals in 2012 to 25% in 2013. The percentage of post-Series A loans with such a feature declined slightly, from 22% in 2012 to 17% for 2013.
Protecting the Value of Your Company's IP for a Successful Acquisition By Kira Kimhi, Partner, and TJ Graham, Associate, Palo Alto When it comes time to sell the company that you've so carefully nurtured along, the purchaser will want to ensure that it gets the full benefit of your company's intellectual property (IP). Typically, the acquirer will focus on the following—and often overlapping—areas: (1) your IP risk, including ongoing or threatened IP infringement litigation, (2) the scope of your IP assets, including how they were acquired and are being protected, (3) your dependence on third parties' IP or technology, and (4) any springing encumbrances affecting the acquirer's IP or business. To make yourself a more attractive acquisition target, it's prudent to minimize your company's IP risk profile ahead of time. In fact, you can avoid the most common pitfalls encountered during M&A diligence by adhering to the simple guidelines described below. Secure IP Assignments from Founders, Employees, and Consultants When forming a company, founders should sign written assignments transferring to the company ownership of relevant pre-existing IP owned by the founders. This step is frequently overlooked by busy founders, but it is important to prospective acquirers. Absent a written assignment, founders retain ownership of their pre-existing IP. As a result, the company (and, in turn, acquirers) face certain risks. If written assignment is delayed until the time of the acquisition, a founder may not be available or willing to sign an assignment. Also, a founder may have the right to bring a claim against the company regarding his or her unassigned IP. In addition, a founder previously may have assigned or licensed the same IP to a third party. Each of these risks can be mitigated if your founders transfer ownership of their pre-existing IP upon joining or forming your new company. These same principles apply to the rest of the employees and consultants performing services for your company. During M&A diligence, acquirers will require a target company to confirm that each past and present employee and consultant has entered into a written binding invention assignment and confidentiality agreement sufficient to transfer ownership of IP created by that person or entity to the company and ensure that they do not divulge the company's confidential information and trade secrets. Consequently, such written invention assignment and confidentiality agreements of sufficient scope should be secured from each employee and consultant upon commencement of their employment with, or services for, your company. In addition, when outsourcing R&D services to employees or contractors outside the United States, be sure to consult with local counsel to ensure that your invention assignment agreements validly effect the assignment of developed IP in accordance with local law. Adopt Sound Practices for Protecting Trade Secrets It is a common and prudent industry practice to enter into written contracts setting limits on the disclosure and use of a company's confidential information. An acquirer will expect your company to have done this. Such contracts are commonly referred to as NDAs (or confidentiality and non-disclosure agreements). In addition, one of the factors courts commonly look for when deciding whether to uphold trade secret protection is whether a company has taken reasonable efforts to maintain secrecy. Therefore, the use of NDAs as a common practice is both prudent and helpful in preserving confidentiality and trade secret protection. Acquirers will seek to confirm in diligence that a company routinely enters into NDAs when sharing its confidential information, and will require that a company make a written representation to that effect. However, a word of caution when relying on NDAs is merited. NDAs come in many flavors and should be narrowly tailored to a particular situation. Also, having an NDA does not guarantee protection of confidentiality, and therefore your company should implement additional security measures and policies. Lastly, NDAs frequently contain unintended terms, such as reallocation of intellectual property rights ownership, patent non-asserts or patent licenses, and residuals clauses, that may be overlooked absent a careful legal review. An acquirer may review your company's NDAs to confirm the adequacy of their scope and the absence of such terms, and will require your company to represent to the same. Understand Implications of Using Open Source Software It has become a common practice for acquirers to conduct independent open source audits. In an independent audit, a third party will audit your company's product and development environment software to identify instances of open source use—and their implications—and to confirm compliance with applicable open source licenses. Because numerous open source licenses exist, your company should implement and adhere to policies governing its use of open source materials, and should seek expert counsel prior to such use. Over the past few years, many serial acquirers have become very sophisticated about, and pay close attention to, open source matters. As a result, lack of open source processes or compliance may cause delays during an M&A transaction, significant remediation expenses, unintended IP infringement liability, or, possibly, a requirement that a company disclose its valuable proprietary source code. You also should expect that your company will be required to make written representations regarding its open source use and compliance. Manage Source Code Carefully Your company's product source code may represent a valuable trade secret. Accordingly, acquirers will ask about instances of source code disclosures to third parties, which can materially affect the value of your company. Acquirers also will ask your company to make a representation about its practices and policies for protecting its source code. Therefore, companies should aim to prevent source code disclosure, or at most limit disclosure of source code to employees and contractors who are subject to confidentiality obligations and require such access to perform their duties. It is not uncommon, however, for customers of early-stage software (including SaaS) companies to request access to product source code. Such customers may be concerned that a start-up could either cease to exist or fail to provide adequate support. Such access is typically accomplished via a deposit of source code in escrow with a third-party escrow agent and conditioned upon the occurrence of certain specified events. Care should be taken when drafting the escrow agreement to narrowly define the deposit materials, the escrow release conditions, and the scope and duration of the license following the release. In particular, your company should avoid escrow release triggers that may restrain its ability to make strategic decisions, especially triggers tied to a change of control, planned obsolescence, and permitted terminations or natural expirations of the contract. Seek the Freedom to Assign Key Contracts Whether or not a particular contract or license can be assigned or otherwise transferred can pose a major roadblock in connection with a merger or acquisition of a company. Generally, potential acquirers want to limit interruptions to a company's business. Therefore, an acquirer will focus its due diligence on assessing whether a target company's business can operate after a merger or acquisition in the same manner in which it had operated immediately prior to such a transaction, without incurring any additional expense and without exposure to additional liability. While a company may not be in a position to negotiate all of its contracts (especially standard contracts with vendors and services providers of widely available technology), the existence of key partners (e.g., a licensor of a key piece of software embedded in a target company's product that cannot be easily replaced) with the power to reject the assignment of a contract or a license agreement to an acquirer may slow down the transaction and create burdensome conditions to closing. In some cases, contracting partners with the power to reject the assignment of key contracts may request additional payment in exchange for their consent. This may result in reduced deal consideration to a company's shareholders. Accordingly, your company carefully should review its contracts for unfavorable assignment provisions, and, as a matter of common practice, seek to secure the right to assign each contract without the counter-party's consent. Avoid Trojans A "trojan" is an encumbrance on an acquirer's IP or business that may arise following the consummation of an M&A transaction as a result of the assumption of certain of the target company's contracts by the acquirer. Careful acquirers commonly review a target's contracts for these types of encumbrances and require the company to represent to the absence of trojans. One example of a trojan is in the context of a license agreement in which a target company grants a patent license to a third party but fails to narrowly define the licensed patents. In this scenario, following the assumption of such license agreement by an acquirer, the acquirer's patent portfolio automatically becomes subject to the license grant. It is not difficult to imagine why this would be problematic for most acquirers. As a result, the target company typically would be required to amend such a license agreement prior to, and usually as a condition to the closing of, an M&A transaction. In this instance, the licensee would have significant leverage and could demand payment to narrow the license, leading to costly negotiations that could delay the consummation of the deal. Consequently, your company should take care when negotiating agreements to avoid terms that may encumber a prospective acquirer's IP or business. In conclusion, the prudent preparation for an exit transaction is mainly a matter of good housekeeping, and your company can avoid expensive and time-consuming surprises by taking the steps outlined above to keep its house in order.
This communication is provided as a service to our clients and friends and is for informational purposes only. It is not intended to create an attorney-client relationship or constitute an advertisement, a solicitation, or professional advice as to any particular situation.. © 2014 Wilson Sonsini Goodrich & Rosati, Professional Corporation Click here for a printable version of The Entrepreneurs Report |
||||||||||||||||||||||||||||||||||||||||||||||||||||||||||||||||||||||||||||||||||||||||||||||||||||||||||||||||||||||||||||||||||||||||||||||||||||||||||||||||||||||||||||||||||||||||||||||||||||||||||||||||||||||||||||||||||||||||||||||||||||||||||||||||||||||||||||||||||||||||||||||||||||||||||||||||||||||||||||||||||||||||||||||||||||||||||||||||||||||||||||||||||||||||||||||||||||||||||||||||||||||||||||
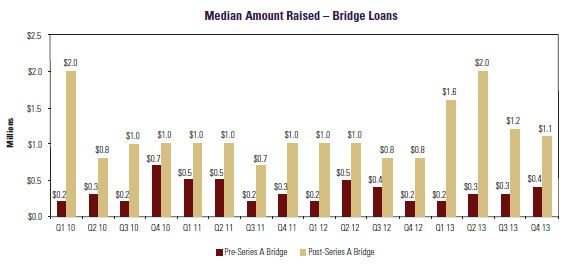 The median amount raised in pre-Series A bridge financings rose from $0.3M in Q3 2013 to $0.4 in Q4, but declined in post-Series A loans, from $1.2M in Q3 to $1.1M in Q4, the lowest point for the year.