
Q4 2011 From the WSGR Database: Financing Trends for Q4 2011
The venture capital financing environment continued to show strength during the fourth quarter of 2011, particularly when looking at valuations. The median pre-money valuation for Series A deals increased significantly from Q3 2011, and is at its highest level in the last two years. Median valuations for Series C and later rounds also increased from the prior quarter, and are near their highest levels in the last two years. Further, 73% of Series B and later transactions were up rounds, continuing a trend that we first saw in the fourth quarter of 2010. These trends largely are driven by investments in social media and other Internet businesses, as well as life sciences and clean technology companies, and are even more impressive considering the volatility in the financial markets during the second half of last year. While there may be concerns that valuations have reached unsustainable levels, we continue to see robust investment activity in 2012, which would be further supported by continued improvement and stability in the exit markets.
Up rounds continued to comprise the substantial majority of equity financings in Q4 2011, at 73% of all deals. This figure is roughly consistent with figures from earlier in the year—75% in Q3, 69% in Q2, and 74% in Q1—but is also up more than 20 percentage points from as recently as Q3 2010. Down rounds as a percentage of total equity financings also stayed roughly constant with the prior 2011 quarters, coming in at 15% of all Q4 financings, versus 15% in Q3, 20% in Q2, and 16% in Q1. Not surprisingly, the proportion of flat rounds also stayed roughly constant, at 12% of all financings, versus 10% in Q3, 11% in Q2, and 11% in Q1. These trends remain positive but, as indicated particularly by the trends in valuation below, may lead some observers to worry about an unsustainable level of activity.
Notably, companies that closed a first round of venture financing in Q4 2011 did so at valuations significantly higher than those prevalent in earlier quarters in 2011. The median pre-money valuation for closings in Q4 2011 Series A rounds (other than angel deals) was $8.0 million, up from $5.6 million in Q3, $5.0 million in Q2, and $5.5 million in Q1. Q4 valuations for more established companies showed mixed results compared with those in prior quarters. Median pre-money valuations for Series B deals decreased from $18.0 million in Q3 2011 to $12.3 million in Q4, although both figures were down substantially from the $29.0 million median Series B pre-money valuation in Q1 2011. For companies raising funds in Series C and later rounds, median pre-money valuations increased significantly from $51.6 million in Q3 2011 to $75.8 million in Q4 2011, similar to the $78.3 million and $71.1 million figures from Q1 and Q2, respectively.
Median amounts raised in closings for Q4 2011 compared with the prior quarter were up for Series A rounds and down for Series B, Series C, and later rounds. For non-angel Series A rounds, median amounts raised rose to $2.0 million in Q4 2011 from $1.4 million in Q3. Median amounts raised for Series B decreased slightly from $4.3 million in Q3 to $3.9 million in Q4. For Series C and later rounds, median amounts raised decreased from $8.8 million in Q3 to $6.0 million in Q4. The increase in median amounts raised in Series A financings likely correlates to the increase in pre-money valuations, as the percentage of ownership given to investors remained relatively constant. Similarly, the decrease in median amounts raised in Series B financings mirrors the decrease in valuations. Deal Terms: Liquidation preferences. The most notable trend in Q4 2011 was the increase in the use of senior liquidation preferences as compared with pari passu liquidation preferences. Senior liquidation preferences were used in 58% of deals in Q4 2011, significantly higher than the 42% figure in Q3 and the 47% figures in both Q1 and Q2. Senior liquidation preferences were used in a full 100% of down rounds, up from 75% in Q3, and were even used in 42% of up rounds, an increase of 14 percentage points over the 28% figure for Q3. This trend most likely reflects increasing valuations, as later-stage investors request seniority in exchange for higher valuations. Participation rights. The proportion of deals with non-participating preferred stock increased from 53% in Q3 2011 to 64% in Q4. This proportion increased in both up rounds, from 51% in Q3 to 68% in Q4, and in down rounds, from 22% in Q3 to 25% in Q4. Among participating preferred, the percentage of deals with capped participating preferred decreased from 26% in Q3 to 19% in Q4 2011, while the percentage of deals with non-capped participating preferred decreased from 21% to 17%. These trends probably reflect greater leverage for founders as valuations increase. Anti-dilution provisions. Broad-based weighted-average anti-dilution continued to be overwhelmingly prevalent, though its proportional use declined somewhat from 93% of all deals in Q3 2011 to 82% in Q4. The use of narrow-based weighted-average declined from 3% to 1%, full-ratchet anti-dilution went from 0% to 6%, and other types of anti-dilution rose from 4% to 11%. As with the increase in seniority preference for new financings, these trends likely result from a trade-off for higher valuations. Pay-to-play provisions. Overall, the use of pay-to-play provisions decreased from 15% of deals in Q3 2011 to 13% in Q4. In Q4, these provisions were used only in respect to future financings, and none were applicable to present financings. The decrease in usage of pay-to-play provisions was particularly notable in up rounds, from 11% of deals in Q3 to 0% in Q4. This trend may reflect a decreasing concern among syndicate partners that their co-investors will be unable to participate in future financings. Redemption. The use of redemption provisions decreased markedly from 32% of deals in Q3 2011 to 17% in Q4. Investor-option redemption (used in 16% of deals in Q4) continued to be far more popular than mandatory redemption (1%). The company-favorable financing terms of 2010 and the first three quarters of 2011 continued in the fourth quarter, reflecting the ongoing relative health of the venture market. To see how the terms tracked in the table on page 3 might be used in the context of a financing, we encourage you to draft a term sheet using our automated Term Sheet Generator. You’ll find a link in the Entrepreneurial Services section of wsgr.com, along with information about the wide variety of services Wilson Sonsini Goodrich & Rosati offers to entrepreneurs and early-stage companies (http://www.wsgr.com/WSGR/Display.aspx?SectionName=practice/entrepreneurialservices.htm). Private Company Financing Trends (WSGR Deals)1
This communication is provided for your information only and is not intended to constitute professional advice as to any particular situation. Please note that the opinions expressed in this newsletter are the authors' and do not necessarily reflect the views of the firm or other Wilson Sonsini Goodrich & Rosati attorneys. © 2012 Wilson Sonsini Goodrich & Rosati, Professional Corporation Click here for a printable version of The Entrepreneurs Report |
|||||||||||||||||||||||||||||||||||||||||||||||||||||||||||||||||||||||||||||||||||||||||||||||||||||||||||||||||||||||||||||||||||||||||||||||||||||||||||||||||||||||||||||||||||||||||||||||||||||||||||||||||||||||||||||||||||||||||||||||||||||||||||||||||||||||||||||||||||||||||||||||||||||||||||||||||||||||||||||||||||||||||||||||||||||||||||||||||||||||||||||||||||||||||||||||||
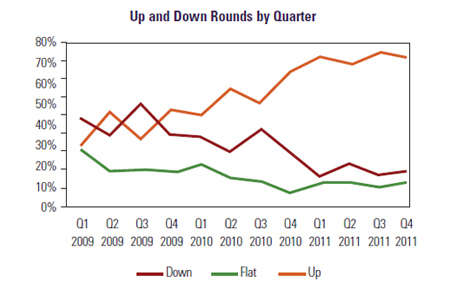 Up and Down Rounds
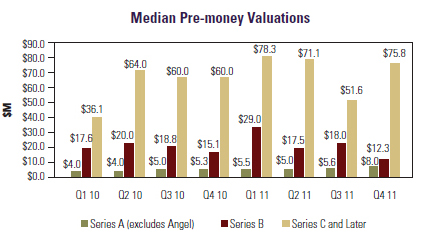 Valuations
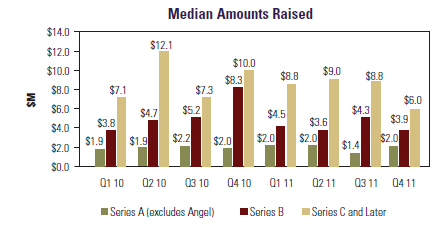 Amounts Raised