Unicorns and Other High-Valuation Deals By Ben Hance, Associate, and Calise Cheng, Partner, Palo Alto Over the last several years, the number of private companies with valuations in excess of $1 billion has skyrocketed, with daily reports of births of new unicorns. As the number of unicorns and even decacorns (private companies with valuations over $10 billion) has grown, voices of concern over an inflating bubble have grown louder. In fact, a shift may already be occurring. There have been recent reports of private companies accepting valuations in the public markets below their last private company valuations, and of late-stage investors marking down the values of their investments. In light of the possible beginning of a correction in the market for late-stage private companies, we have taken a closer look at the terms of 48 private company financings that closed between January 1, 2014, and September 30, 2015, in which the issuers pre-money valuation exceeded $700 million.1 As further described below, the relative lack of special protections for late-stage investors reflects the strong market power during this period of late-stage companies perceived to be highly desirable. This market power provided an ability to dictate not only high valuations, but also very favorable terms that in many cases did not vary meaningfully from standard early-stage venture capital terms. If the market does indeed correct, it is likely that financing terms for later-stage deals will change in the upcoming months.
In our review, we looked at the liquidation preferences associated with the securities issued in these financings to determine whether these securities entitled their holders to some guaranteed return (for example, in the form of a greater than 1x liquidation preference) before any proceeds flow to the common or prior preferred investors. With respect to liquidation preferences, we compared these high-valuation financings to a generalized sample set of over 800 private company financings that closed during the same period at any valuation level or stage of investment. We also looked at whether these securities carried special conversion rights protecting them against automatic conversion into common shares in a low-valuation IPO. Our findings suggest that only a distinct minority of investors in high-valuation financings during this period received rights and preferences that are more protective than those found in venture-backed, Silicon Valley financings generally. Consequently—at least with respect to the terms that we reviewed—late-stage investors generally share the risk of a low-valuation company sale or IPO with early-stage investors, despite the correspondingly increased risk of a downside exit relative to the higher price of their securities. M&A Protections The first term that we reviewed was preferential liquidation rights, or liquidation preferences, which give preferred shareholders the right to receive proceeds equal to their invested capital (or, in some cases, a multiple thereof) before the common shareholders (or, in some cases, other preferred investors) receive proceeds from a company sale. We found that a large majority of the reviewed securities carried a standard 1x, non-participating liquidation preference. Specifically, approximately 80% of these securities carried a 1x liquidation preference, and 88% did not carry the right to participate in common stock proceeds. These terms are comparable to those of preferred securities generally, where 93% carried a 1x liquidation preference and 76% were non-participating. A majority of these securities also carried a liquidation preference pari passu with one or more pre-existing series of preferred, with only 25% carrying a liquidation preference senior to earlier series. This is less prevalent than the 39% of preferred securities generally that carry a senior liquidation preference in the comparison sample set. These results suggest that if late-stage investors during this period were concerned about a sale of the company that would result in a return less than their target threshold, their protection of choice did not generally take the form of a greater than 1x or participating liquidation preference. Similarly, late-stage investors did not appear to be obtaining a senior liquidation preference to protect against the company being sold at a price that fails to clear the companys aggregate liquidation preference. IPO Protections
We found that approximately 35% of the high-valuation financings carried one or both of these special IPO-related protections.
Other Protective Provisions Nearly all of the securities that we examined carried terms that required the vote of all preferred shares voting as a single class to approve certain corporate actions. In most instances, a majority vote was required, while others required a supermajority vote; however, only with respect to 14% of the securities was the approval requirement in excess of 60%. Typical actions requiring approval include an amendment to the certificate of incorporation, an increase in the number of authorized common or preferred shares, the creation of a new class of securities, and the consummation of a merger or acquisition. In only two cases did such provisions specifically require a vote by the preferred stockholders to conduct an initial public offering.
Conclusion Some observers have commented that the terms of recent high-valuation financings provide protections to late-round investors that could seriously impair returns to early-stage investors and founders. Although we found a few such deals, the majority of high-valuation financings that closed in 2014 and the first three quarters of 2015 appear to carry terms and conditions that are common to most private company investments, regardless of valuation. As noted above, if very recent trends continue, it is likely that these terms will become less company-favorable in the future. 1Of the 48 financings, 38 had valuations in excess of $1 billion, and 38 were Series D or later. WSGR participated in approximately 60% of these transactions as company or investor counsel; the terms of the remainder of such transactions (all at valuations of $1 billion or more) were obtained from examination of public records. | |||||||||||||||||||||||||||||||||||||||||||||||||||||||||||||||||||||||||||||||||||||||||||||||||||||||||||||||||||||||||||||||||||||||||||||||||||||||||||||||||||||||||||||||||||||||||||||||||||||||||||||||||||||||||||||||||||||||||||||||||||||||||||||||||||||||||||||||||||||||||||||||||||||||||||||||||||||||||||||||||||||||||||||||||||||||||||||||||||||||||||||||||||||||||||||||||||||||||||||||||||||||||||||||||||||||||||||||||||||||||||||||||||||||||||||||||||||||||||||||||||
|
Wilson Sonsini Goodrich & Rosati partners Todd Carpenter and Rachel Proffitt recently sat down with serial entrepreneur and angel investor Jason Calacanis to discuss the current state of the venture market, his criteria for investment, advice for entrepreneurs, and the San Francisco start-up landscape, among other topics.
Weve done two programs so far. The first time, we had 150 people apply and we accepted seven. The second time, we had 350 people apply and we accepted eight. So, we have a low acceptance rate and very high expectations. The program is 12 weeks and 18 sessions, and each session is three to four hours long. I personally do 14 of the 18 sessions. Its as intense as anything gets in the industry, and its a much smaller group of people, so theres nowhere to hide. When determining who to invite to the program or whether to invest in a start-up, my focus is on whether or not the founders can execute at a high level. We look at their work product coming in, not a business plan, and we ask, Is this executed really well? Is the design exceptional? Are the idea and the behavioral hook really well executed? If people dont execute at a high level, the chances of them magically finding a team member who can do so are very low. What Ive realized is this is where I can be most helpful in my role as an angel investor. Theres nothing like spending this amount of time with people. You cant compare it to any other angel investing. Many early-stage companies say that seed and angel investors have raised the bar and are now asking for metrics and traction much earlier in the life cycle of the company. Entrepreneurs are being asked to do more with less. What advice do you have for them? Great question. When I started in the industry, angels gave you money to work on your business plan and then you got your Series A to build out your product and launch it. Then it was the seed investors who got the product to market and the Series A investors who scaled it. Now we have the seed investors asking for traction. Eventually the seed investors are going to be asking you to scale, which would be ridiculous. All of this is a function of more entrepreneurial activity. As the number of entrepreneurs goes up, so does the number you have to accept into an incubator and the number of choices you have as an angel investor. You could easily ding people and say, Im not investing in business plans anymore and Im not investing in prototypes anymore; I want a product thats launched. I dont subscribe to that. I will accept people who dont have a finished product, if I know them and their track record. But, lets face it, I dont have to. Given the choice, Im taking the person who has the more finished product. What that means is that I see a lot of entrepreneurs working on weekends and nights while theyre at Google or Facebook, getting a waiver from their employers, and in some cases having their IP cleaned up and using their own computers. No Hooli lawsuits about using the work computer. You often have to be able to build your product while working somewhere else, while saving up a little bit of money. Its unrealistic to expect a business plan, a mock-up, or even a prototype to get funded today. I think you have to have a finished product, even if its a very basic MVP. Whats your view of the overall state of the broader venture market beyond just seed-stage capital? Theres never been this many companies executing at such a high level, which is leading to a lot of good, deserving companies not getting funded. There are companies not getting funded today that five years ago would have had no problem closing an A round or even a B round. The goal posts have moved. Were no longer playing a hundred-yard game—its a thousand-yard game. The stakes have gone up, but the number of investors and VCs is not growing as fast as the number of companies. At the same time, you have this new class of super angels, like me, who are helping. Then youre seeing a lot of this seed, seed-plus, seed-plus-plus. And Im advising a lot of people, saying, Hey, imagine a world where you cant get an A, but you do have $1 million in revenue. What does that look like? How do you get alternate sources of funding? From my 20 years of experience as an entrepreneur, I always like to have multiple strategies for getting out alive. I look at it like Indiana Jones or James Bond. Youre in the middle of the evil lair and you should have more than one exit possibility, because when the shit hits the fan—which it inevitably does—you want to have options. A lot of entrepreneurs dont think that way. They just think, Ill go back to my existing investors, where Sequoias going to give me my A round and Andreessens going to give me my A round. Thats just not realistic anymore. You have to have that A-plus round or that C-plus round. You have to be able to go to those existing investors and ask, Hey, what do I need to prove to get you to match what you previously put in? Thats why Im only investing in people who agree to do a monthly update. Not because Im a control freak, but because if youre updating investors monthly, the chances of them investing in you again when you do hit inevitable roadblocks go up exponentially. You have a 10 times better chance if youve kept people informed. If you havent, and the next time they hear from you is when youre out of money, thats not going to go well for you. I have frank discussions where I say, Are you okay with sending me an update every month where the first line is how much cash you have, how much youre burning, and how many months are left? Are you okay with sending me a revenue chart, or monthly active use charts, even if its bad? Just be candid and honest. Im training the entrepreneurs I work with on how to deal with the Series A crunch. There are just too many options for investors, so a lot of investors are going later and later stage. Its great for me, because I dont have a lot of competition. As a high-profile angel, I basically get my pick of the litter. There are so many incubators that I can go into any of them and pick the top three companies, and therell be room for me in the round. It didnt used to be like that. There used to be more competition in the early stage. But the competitions in the later stage now, where everybodys trying to put big swaths of money to work—$100 million, $200 million for an Instacart or Uber or Airbnb. Valuations are going up there because cash-on-cash people can make a lot of money. You mentioned a monthly update. Entrepreneurs often ask us what should be included in one and what format to use. Do you have any resources or examples they should see? On Calacanis.com, I list six or seven items that should be in your monthly update. For me, most people do it in reverse. Angels want to know when youre going to run out of money and how much money youre going to make. Usually I can tell how well things are going by the frequency of updates. I literally keep a Google spreadsheet and mark in green when we receive updates. If we dont have an update for a particular month, its red. We have an internal joke that if we dont get an update in three months, the companys going to be out of business in the next three months. This lets us do an intervention, where we say, Hey, we havent heard from you in three months, the last update we have is on this date. A lot of other investors dont do this, but its my early warning system. People shouldnt hide the key metrics. How has your transition from LA to San Francisco been? Any surprises or challenges? I love it here; its been great. It reminds me of New York in the 90s, when people thought anything was possible. It really is, if youre an entrepreneur. The opportunity, the amount of money, and the amount of positivity . . . the crazier the idea, the more time people seem to give it here. This market is the most unique in the world. The relentlessness of people, the collisions—it really is even greater than I expected. People stop me on the street and say, Hey, I love the podcast, Hey, I went to this event, or Hey, you gave me a free ticket to something, I appreciate that. And then they say, Oh, also, my friends got this cool company. So, I put it out there on Twitter and on my podcast, if you know somebody great whos doing something interesting, dont ask me if you can introduce me to themjust introduce me to them. Yes, real estates a problem—the rents too damn high. I took out a map and started asking, Why arent there offices in this swath of land or that swath of landSunset, Richmond, Dogpatch, this place, that place? I was told you cant have offices in certain places. I said, Really? Because I see all these office spaces—this person has a dentists office you could rip out and put 20 desks in at $25 per square foot. Why wouldnt you do that instead of paying $100 per square foot? It doesnt make any sense to me. Peoples imaginations just suck. Other than that, were living in the city of the future. If you want something on demand, there are four different services that can bring it to your house. This place is turning into Manhattan. As someone who spent 10 years of his life in Manhattan and 20 years in Brooklyn, I love it. I understand its tragic for people who are native San Franciscans to lose the Summer of Love, hippie culture, and things that make this town unique, but progress waits for no city. And most cities are dying to get what this city already has. Are we in a bubble? I think there are bubbly aspects to the late-stage stuff. But if you dig deeper, take the last rounds of financing, and compare them to previous IPOs, it looks normal. So no, I dont think its a bubble in the late stage. Its just private IPOs occurring. We used to have IPOs where companies had $25 or $50 million in revenue. Now we have IPOs where they have $500 million or $1 billion in revenue. Were adding a zero. If youre going 10x, yes, it may look like a bubble, but it used to be a big deal when a company IPOd and it was worth $500 million or $1 billion. That would be disappointing, wouldnt it? I mean, is there even a place for somebody to IPO worth a billion? Does it really exist? If you look at the early stage, is there a problem with the number of companies? Yes. Is there a bubble in the number of people employed by, and the overhead and the money invested in, those companies? No. So there are two distinct bubbles there. One is the size of the investments going on in the late stage and the other is the number of companies in the early stage. If both of those bubbles were to theoretically pop, what would happen? We would lose 1,000 start-ups that have under five employees each, so 5,000 people would lose their jobs and go work for the big companies. We just solved the talent problem. I feel very bullish about everything, actually. I think the U.S. has never been stronger. The number of people who want to be entrepreneurs is growing, and their abilities are growing. The quality of work today is great. If you took my weakest angel investment today, it would be my best angel investment just seven or eight years ago in terms of execution at that early stage. If you were to quit your day job and be an entrepreneur full time, is there a particular area of market that you would focus on? I consider myself an entrepreneur in the angel investing space. One of the great things about being an angel investor is that I can participate in a lot of areas. Theres the on-demand dichotomy. Obviously Ive done pretty well with Uber, and Im also an investor in Bento, which graduated from our first incubator class. Watching this on-demand economy grow, its getting flooded. We have on-demand almost everything here in San Francisco, but ask anybody in another neighborhood city, and theyre asking, When do I get something on demand? That revolution is still in the first inning. I think theres going to be something around equity crowd funding. Im concerned about a lot of the early efforts outside of AngelList. Ive watched some people start doing equity crowd funding where theyve taken the marketing approach of Kickstarter or Indiegogo and applied it to equity, which means doing PR and marketing and trying to convince people to buy the product, except the product is a share in a company. That seems like a recipe for disaster. I didnt exactly believe in the drone space and now Im starting to see the applications of it. I think I may have missed that whole wave. I think augmented reality is going to be pretty interesting, too. Its different than virtual reality, where you put the headset on. With augmented reality and wearables, we had a couple of false starts with Google Glass and the Apple Watch, but I think wearables are actually one more rev of Moores law, once everything is just a little more dialed in. Maybe 18 or 36 months from now, theyre going to look radically different. Boy, its going to be interesting when you put some glasses on and above peoples heads at a bar, itll tell you how many Twitter followers they have and when you last talked to them, and show you email and if theyre following you on Twitter. It would be scary and insane, but it would be very interesting. Jason is an angel investor in more than 60 start-ups, including Uber.com (first round). He has a $10 million angel fund and hosts the largest start-up conference in the world. Jason maintains a blog at http://calacanis.com and you can follow him on Twitter @Jason. | |||||||||||||||||||||||||||||||||||||||||||||||||||||||||||||||||||||||||||||||||||||||||||||||||||||||||||||||||||||||||||||||||||||||||||||||||||||||||||||||||||||||||||||||||||||||||||||||||||||||||||||||||||||||||||||||||||||||||||||||||||||||||||||||||||||||||||||||||||||||||||||||||||||||||||||||||||||||||||||||||||||||||||||||||||||||||||||||||||||||||||||||||||||||||||||||||||||||||||||||||||||||||||||||||||||||||||||||||||||||||||||||||||||||||||||||||||||||||||||||||||
From the WSGR Database: Financing Trends for Q3 2015
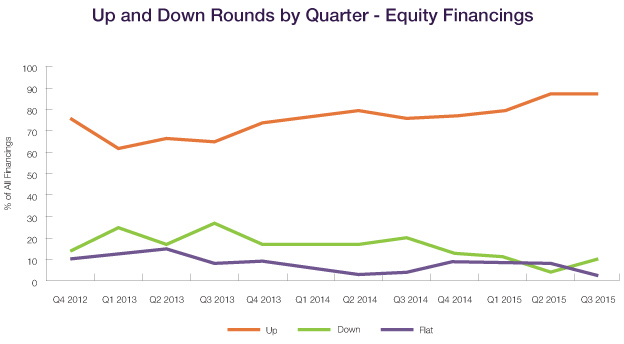
As broadly reported, the number of venture deals dropped dramatically between Q2 and Q3 2015. However, valuations of companies at all stages of growth remained strong. The terms of most financings remained founder-favorable, even at very high valuations, as discussed the article titled Unicorns and Other High-Valuation Deals in this issue.
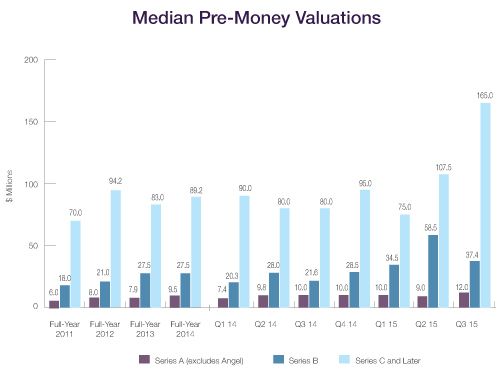
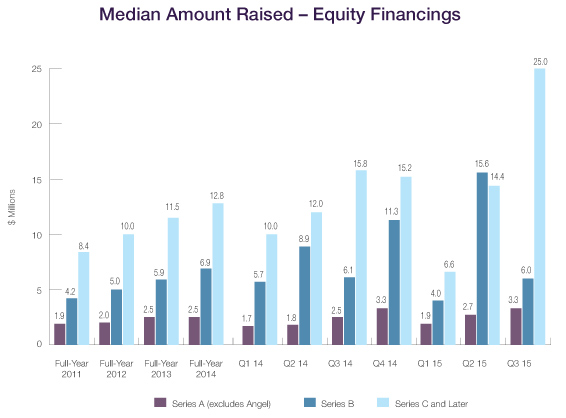
Private Company Financing Deal Terms (WSGR Deals)1
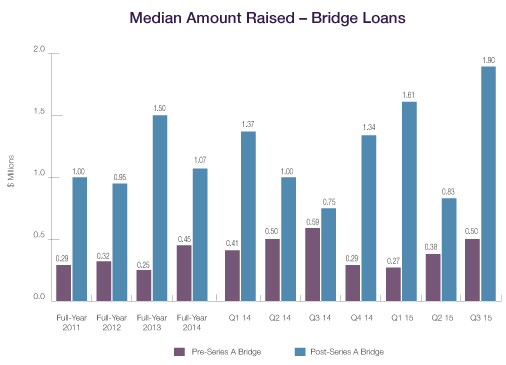
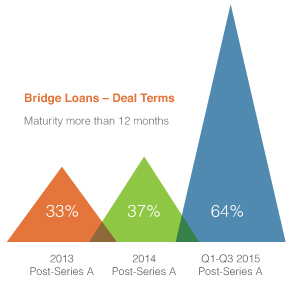
Bridge Loans The Q3 2015 median amount raised in pre-Series A bridge financings was $0.50 million, more than in Q1 and Q2 2015 and slightly above that for full-year 2014 as well. The Q3 2015 median amount raised for post-Series A bridge financings rose to $1.90 million, the highest amount in the past five years. Deal Terms for Bridge Loans Terms for bridge loans this year have been relatively company-favorable. Annual interest rates of less than 8% were used in 74% of pre-Series A deals and 56% of post-Series A deals for Q1-Q3 2015. In addition, maturities continued to lengthen; 77% of pre-Series A deals and 64% of post-Series A deals had maturities in excess of one year. As we observed in the last issue of The Entrepreneurs Report, this trend may indicate a belief by investors that financing opportunities for later-stage companies will remain strong for an extended period. Only 4% of pre-Series A deals and 24% of post-Series A deals carried warrants during Q1-Q3 2015. Conversion from debt to preferred stock was subject to a price cap for 65% of pre-Series A loans, and a strong majority of both pre-Series A loans (78%) and post-Series A loans (72%) convert at a price discount. Bridge Loans – Deal Terms (WSGR Deals)1
Methodology for WSGR's Entrepreneurs Report
This communication is provided as a service to our clients and friends and is for informational purposes only. It is not intended to create an attorney-client relationship or constitute an advertisement, a solicitation, or professional advice as to any particular situation.. © 2015 Wilson Sonsini Goodrich & Rosati, Professional Corporation Click here for a printable version of The Entrepreneurs Report |
|||||||||||||||||||||||||||||||||||||||||||||||||||||||||||||||||||||||||||||||||||||||||||||||||||||||||||||||||||||||||||||||||||||||||||||||||||||||||||||||||||||||||||||||||||||||||||||||||||||||||||||||||||||||||||||||||||||||||||||||||||||||||||||||||||||||||||||||||||||||||||||||||||||||||||||||||||||||||||||||||||||||||||||||||||||||||||||||||||||||||||||||||||||||||||||||||||||||||||||||||||||||||||||||||||||||||||||||||||||||||||||||||||||||||||||||||||||||||||||||||||
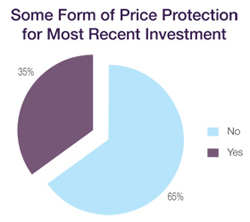 We also sought to determine whether investors were obtaining special protections against being involuntarily converted into common stock in connection with a low-valuation IPO. We looked at two potential forms of protection: (1) a definition of Qualified IPO (which triggers an automatic conversion of preferred shares into common shares) that provides for some minimum valuation of the company at the IPO, and (2) a special conversion rate adjustment that potentially results in more common shares being issued to the preferred shareholders upon conversion to common upon an IPO, so that the aggregate value of the common shares they receive upon conversion achieves some target return.
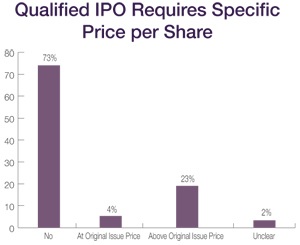 The first form of investor protection—a Qualified IPO automatic conversion trigger that includes a valuation threshold, expressed either as a minimum issue price per share or as a minimum company market cap—was found in only a minority of the high-valuation financings that we reviewed. Only 27% of preferred shares had a Qualified IPO definition that included a price-per-share threshold that was clearly at or higher than the original issue price of the preferred shares, and only 10% required that the IPO carry a minimum market capitalization for the company. If a companys IPO does not meet the Qualified IPO definition, consent of the holders of the preferred stock would be required for automatic conversion to common stock at IPO. This could potentially result in investors bargaining for additional shares or other rights at the time of the IPO.
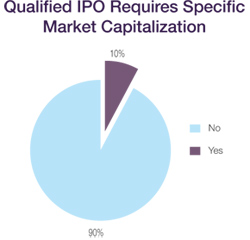 Similarly, only 10% of the high-valuation securities included a special conversion rate adjustment that provides the preferred shareholders with additional shares of common stock so that the value of the common shares they receive upon conversion of their preferred shares in an IPO achieves some target return. We note that comparable data for the general sample set was unavailable. These types of adjustments allow investors to be less valuation-sensitive at the time of the investment, because they will be protected if the valuation at IPO falls below expectations, or even below the valuation at the time of the investment.
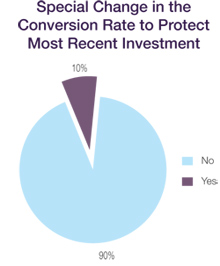 Special protective provisions for each series of preferred were also prevalent. However, these provisions normally only provided a special series vote on amendments to the certificate of incorporation that would impair the rights, privileges, and preferences of such securities. In only 12% of the cases did such provisions require a separate series vote on mergers and acquisitions, and there were no instances in which a vote by the holders of the high-valuation securities was required to approve an IPO.
 Tell us about your accelerator program. What are the key characteristics you look for in determining whether to invest in a start-up or to invite them to participate in your program?