From the WSGR Database: Financing Trends for Q3 2014
For purposes of the statistics and
charts in this report, our database
includes venture financing
transactions in which Wilson
Sonsini Goodrich & Rosati
represented either the company or
one or more of the investors.
|
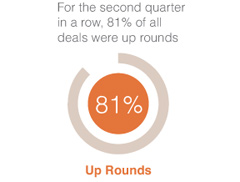
We are pleased to report that the venture market remained robust during the third quarter of 2014. For the second consecutive quarter, 81% of all deals were up rounds, once again the highest percentage recorded by the WSGR database since the firm started tracking these numbers. Total dollars invested declined from a record high in Q2 2014, but still exceeded the amount invested in the same quarter last year.
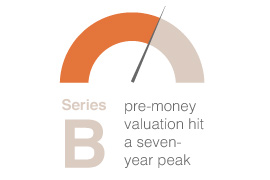
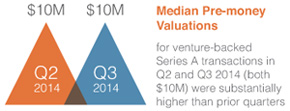
Median amounts raised and pre-money valuations mostly retreated from recent highs, but remained strong. The median pre-money valuation in Series B closings was notably the highest in recent memory, and median pre-money valuations for venture-backed Series A transactions in Q2 and Q3 2014 (both $10.0 million) were substantially higher than at any time since we began tracking medians in 2008.
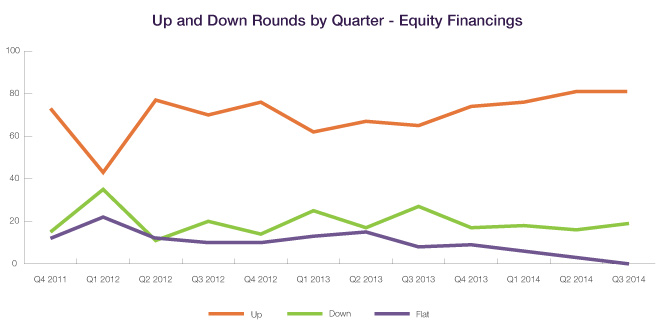
Up and Down Rounds
Up rounds remained at a historical high while down rounds increased slightly, from 16% to 19% of all deals. Flat rounds fell to zero.
 |
 |
|
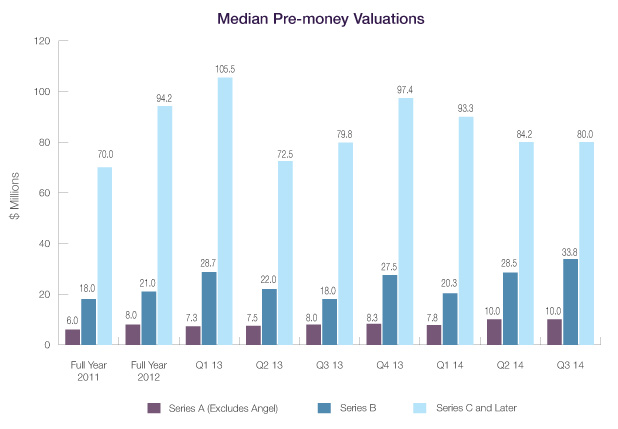
Valuations
The Q3 2014 median pre-money valuation in Series A deals backed by venture and corporate strategic investors held steady at $10.0 million. Meanwhile, the Q3 median Series B pre-money valuation was $33.8 million, higher than any quarter since 2007. The Q3 median pre-money valuation for Series C and later rounds was $80.0 million, lower than the previous three quarters, but approximately the same as in Q3 2013.
|
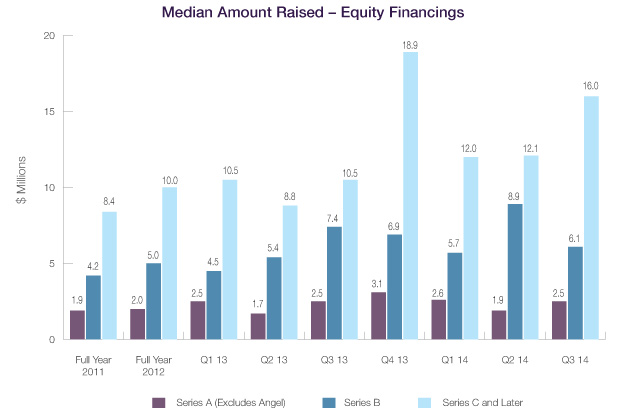
Amounts Raised
The Q3 2014 Series A median amount raised was $2.5 million, more than in Q2 but slightly less than in Q1. In contrast, the Series B median amount raised ($6.1 million) followed the reverse pattern; it was substantially less than the Q2 median, but slightly more than the Q1 median. The Series C median amount raised was $16.0 million—substantially higher than the medians in both Q2 and Q1 of $12.1 million and $12.0 million, respectively.
|
|
Deal Terms
Liquidation preferences. Only 37% of Series B and later deals in Q1-Q3 2014 had a senior liquidation preference, down from 41% in full-year 2013. Use of a senior liquidation preference was more popular in down rounds, at 65% of all deals, but this figure was overwhelmed by the much larger number of up rounds, where 32% of deals had a senior liquidation preference.
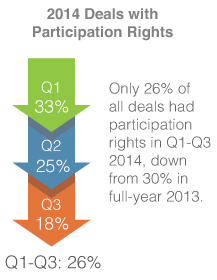 Participation rights. Only 26% of deals had participation rights in Q1-Q3 2014, down from 30% in full-year 2013. Deals with participation rights were evenly split between those where the participation was capped at a multiple of the liquidation preference (13%) and those without a cap (13%). Participation rights were used in 46% of Q1-Q3 2013 down rounds; in these deals, uncapped rights were much more popular (31%) than capped rights (15%). Participation rights. Only 26% of deals had participation rights in Q1-Q3 2014, down from 30% in full-year 2013. Deals with participation rights were evenly split between those where the participation was capped at a multiple of the liquidation preference (13%) and those without a cap (13%). Participation rights were used in 46% of Q1-Q3 2013 down rounds; in these deals, uncapped rights were much more popular (31%) than capped rights (15%).
Dividends. Non-cumulative dividends were used in 74% of all deals in Q1-Q3 2014, the same as in full-year 2013. Use of non-cumulative dividends was more prevalent in up rounds (79% of deals) than in down rounds (73%); in fact, the percentage of down rounds with cumulative dividends rose from 13% in full-year 2013 to 23% in Q1-Q3 2014.
Anti-dilution provisions. The use of broad-based weighted-average anti-dilution provisions declined from 95% of deals in full-year 2013 to 91% for Q1-Q3 2014. Broad-based weighted-average anti-dilution was used more frequently in both up rounds (94%) and down rounds (96%), but much less in Series A rounds (88%), resulting in the overall figure of 91%.
Other provisions. During Q1-Q3 2014 there were no statistically significant changes in the frequency of pay-to-play provisions or redemption features. The use of investor-option redemptions, which had climbed to 40% of down rounds in 1H 2014, dropped to 27%, closer to its historical usage. We had previously speculated that the high 1H 2014 number was a function of the small number of down rounds during that period; the reversion to the historical figure is consistent with having a larger data set for three quarters.
To see how the terms tracked in the table below can be used in the context of a financing, we encourage you to draft a term sheet using our automated Term Sheet Generator. You'll find a link in the
Entrepreneurial Services section of the firm's website (www.wsgr.com), along with information about the wide variety of services that Wilson Sonsini Goodrich & Rosati offers to entrepreneurs and early-stage companies.
Private Company Financing Trends
(WSGR Deals)1
|
2011 |
2012 |
2013 |
Q1-Q3 2014 |
2011 |
2012 |
2013 |
Q1-Q3 2014 |
2011 |
2012 |
2013 |
Q1-Q3 2014 |
All Rounds2 |
All Rounds2 |
All Rounds2 |
All Rounds2 |
Up Rounds3 |
Up Rounds3 |
Up Rounds3 |
Up Rounds3 |
Down Rounds3 |
Down Rounds3 |
Down Rounds3 |
Down Rounds3 |
Liquidation Preferences - Series B and Later |
Senior |
47% |
37% |
41% |
37% |
34% |
30% |
38% |
32% |
79% |
56% |
47% |
65% |
Pari Passu with Other Preferred |
51% |
58% |
55% |
59% |
64% |
67% |
60% |
66% |
18% |
39% |
37% |
27% |
Complex |
1% |
2% |
3% |
2% |
1% |
2% |
2% |
2% |
3% |
0% |
11% |
4% |
Not Applicable |
1% |
3% |
1% |
2% |
1% |
1% |
0% |
1% |
0% |
5% |
5% |
4% |
Participating vs. Non-participating |
Participating - Cap |
16% |
14% |
18% |
13% |
17% |
13% |
20% |
15% |
22% |
17% |
23% |
15% |
Participating - No Cap |
26% |
19% |
12% |
13% |
24% |
20% |
10% |
11% |
46% |
41% |
30% |
31% |
Non-participating |
58% |
67% |
70% |
74% |
59% |
67% |
69% |
74% |
32% |
41% |
48% |
54% |
Dividends |
Yes, Cumulative |
11% |
9% |
12% |
13% |
11% |
10% |
12% |
11% |
19% |
12% |
13% |
23% |
Yes, Non-cumulative |
78% |
78% |
74% |
74% |
79% |
81% |
79% |
79% |
73% |
78% |
79% |
73% |
None |
11% |
13% |
14% |
13% |
10% |
9% |
9% |
10% |
8% |
10% |
8% |
4% |
Anti-dilution Provisions |
Weighted Average - Broad |
91% |
92% |
95% |
91% |
91% |
92% |
96% |
94% |
80% |
85% |
97% |
96% |
Weighted Average - Narrow |
4% |
3% |
3% |
7% |
7% |
3% |
3% |
5% |
6% |
5% |
0% |
4% |
Ratchet |
3% |
3% |
1% |
1% |
2% |
2% |
0% |
1% |
6% |
8% |
3% |
0% |
Other (Including Blend) |
3% |
3% |
1% |
1% |
1% |
3% |
1% |
0% |
9% |
3% |
0% |
0% |
Pay to Play - Series B and Later |
Applicable to This Financing |
6% |
5% |
5% |
4% |
1% |
1% |
1% |
1% |
20% |
23% |
15% |
15% |
Applicable to Future Financings |
6% |
3% |
1% |
0% |
4% |
3% |
1% |
0% |
11% |
3% |
0% |
0% |
None |
88% |
92% |
95% |
96% |
94% |
96% |
98% |
99% |
69% |
74% |
85% |
85% |
Redemption |
Investor Option |
22% |
22% |
19% |
17% |
25% |
23% |
20% |
23% |
32% |
35% |
33% |
27% |
Mandatory |
2% |
1% |
1% |
3% |
2% |
1% |
2% |
3% |
3% |
3% |
0% |
4% |
None |
77% |
77% |
80% |
80% |
73% |
76% |
78% |
74% |
65% |
63% |
67% |
69% |
| 1We based this analysis on deals having an initial closing in the period to ensure that the data clearly reflects current trends. Please note that the numbers do not always add up to 100% due to rounding. |
| 2Includes flat rounds and, unless otherwise indicated, Series A rounds. |
| 3Note that the All Rounds metrics include flat rounds and, in certain cases, Series A financings as well. Consequently, metrics in the All Rounds column may be outside the ranges bounded by the Up Rounds and Down Rounds columns, which will not include such transactions. |
| |
Bridge Loans
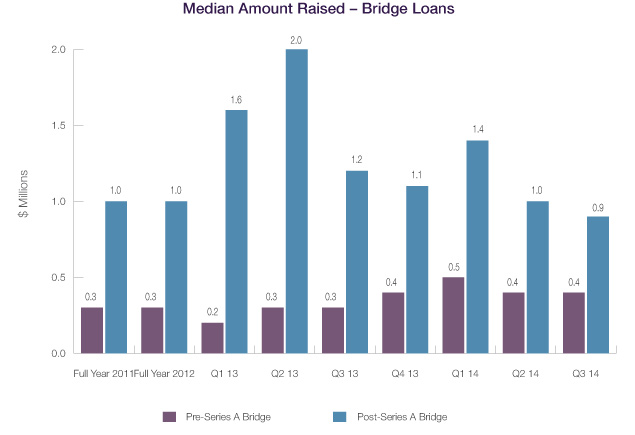 The Q3 2014 median amount raised in pre-Series A bridge financings was $0.4 million, slightly above its long-term median. The principal amount of post-Series A loans continued to fall, from $1.4 million in Q1 2014 to $1.0 million in Q2 2014 and $0.9 million in Q3 2014. The Q3 2014 median amount raised in pre-Series A bridge financings was $0.4 million, slightly above its long-term median. The principal amount of post-Series A loans continued to fall, from $1.4 million in Q1 2014 to $1.0 million in Q2 2014 and $0.9 million in Q3 2014.
Interest Rates. Interest rates of less than 8% per annum continued to be the most frequent option for pre-Series A loans, at 76% of such loans for Q1-Q3 2014, up from 70% for full-year 2013. Nearly half of post-Series A bridge loans (47%) carried an interest rate of 8% in Q1-Q3 2014, up from 34% in 2013. The increase in deals with a rate of exactly 8% resulted predominately from a decrease in the percentage of deals with lower rates from 46% of post-Series A deals in 2013 to 38% in Q1-Q3 2014.
Maturities. The decline in maturities for pre-Series A bridge loans first noted in 1H 2014 continued in Q3, with the percentage of such deals having maturities of 12 months or longer declining from 97% in 2013 to 90% in Q1-Q3 2014. For post-Series A loans, maturities of 12 months or more decreased slightly, from 71% of all such loans in 2013 to 70% in Q1-Q3 2014.
Subordinated Debt. The use of subordinated debt continued to increase for pre-Series A bridge loans, rising from 25% in 2013 to 27% in Q1-Q3 2014. For post-Series A loans, subordination declined from 56% of deals in 2013 to 47% for Q1-Q3 2014.
 Warrants. Few pre-Series A loans have warrants, so we did not examine trends in warrant coverage for those deals. For post-Series A loans, the use of warrants declined from 34% of deals in 2013 to 25% in Q1-Q3 2014. Warrants. Few pre-Series A loans have warrants, so we did not examine trends in warrant coverage for those deals. For post-Series A loans, the use of warrants declined from 34% of deals in 2013 to 25% in Q1-Q3 2014.
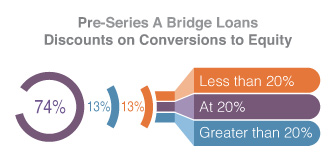
Conversion. The percentage of pre-Series A bridge loans subject to an explicit price cap on conversion jumped from 68% of deals in 2013 to 89% in Q1-Q3 2014. In addition, 89% of all loans in Q1-Q3 2014 were convertible at a discounted price, down slightly from 91% in 2013. The percentage of post-Series A bridge loans subject to a price cap also increased, although they remained a much smaller percentage of all deals, rising from 14% in 2013 to 24% in Q1-Q3 2014. The percentage of post-Series A loans convertible at a discounted price increased from 59% of all deals in 2013 to 72% in Q1-Q3 2014.
Multiples. Provision for repayment at a multiple of the loan value in the event of an acquisition fell for pre-Series A loans, from 25% of deals in 2013 to 20% in Q1-Q3 2014. The percentage of post-Series A loans with such a feature increased, from 17% of deals in 2013 to 24% in Q1-Q3 2014.
Trends in Bridge Loans
Bridge Loans1 |
2012
Pre-Series
A |
2013
Pre-Series A |
Q1-Q3 2014
Pre-Series A |
2012
Post-Series A |
2013
Post-Series A |
Q1-Q3 2014
Post-Series A |
Interest rate less than 8% |
64% |
70% |
76% |
44% |
46% |
38% |
Interest rate at 8% |
30% |
29% |
22% |
41% |
34% |
47% |
Interest rate greater than 8% |
5% |
1% |
2% |
15% |
20% |
15% |
Maturity less than 12 months |
8% |
3% |
9% |
34% |
29% |
30% |
Maturity at 12 months |
30% |
19% |
23% |
36% |
38% |
41% |
Maturity more than 12 months |
62% |
78% |
67% |
30% |
33% |
29% |
Debt is subordinated to other debt |
13% |
25% |
27% |
39% |
56% |
47% |
Loan includes warrants2 |
8% |
4% |
0% |
32% |
34% |
25% |
Warrant coverage less than 25% |
20% |
0% |
N/A |
42% |
50% |
67% |
Warrant coverage at 25% |
40% |
0% |
N/A |
33% |
12% |
0% |
Warrant coverage greater than 25% |
20% |
100% |
N/A |
14% |
38% |
33% |
Warrant coverage described as variable or "other" |
20% |
0% |
N/A |
12% |
0% |
0% |
Principal is convertible into equity3 |
99% |
100% |
100% |
97% |
94% |
95% |
Conversion rate subject to price cap |
65% |
68% |
89% |
24% |
14% |
24% |
Conversion to equity at discounted price4 |
79% |
91% |
89% |
52% |
59% |
72% |
Discount on conversion less than 20% |
17% |
17% |
13% |
15% |
16% |
26% |
Discount on conversion at 20% |
54% |
60% |
74% |
46% |
46% |
42% |
Discount on conversion greater than 20% |
29% |
22% |
13% |
39% |
38% |
32% |
Conversion to equity at same price as other investors |
12% |
9% |
9% |
38% |
35% |
25% |
Repayment at multiple of loan on acquisition |
16% |
25% |
20% |
20% |
17% |
24% |
1We based this analysis on deals having an initial closing in the period to ensure that the data clearly reflects current trends. Please note that the numbers do not always add up to 100% due to rounding.
2Of the 2013 pre-Series A bridges that had warrants, 33% also had a discount on conversion into equity. Of the 2013 post-Series A bridges with warrants, 24% also had a discount on conversion into equity. Of the Q1-Q3 2014 post-Series A bridges with warrants, 36% also had a discount on conversion into equity.
3 This includes notes that provide for voluntary as well as automatic conversion.
4Of the 2013 pre-Series A bridges that had a discount on conversion into equity, 2% also had warrants. Of the 2013 post-Series A bridges that had a discount on conversion into equity, 15% also had warrants. Of the Q1-Q3 2014 post-Series A bridges that had a discount on conversion into equity, 13% also had warrants.
|
WSGR Methodology
The Up/Down/Flat analysis is based on WSGR deals having an initial closing in the period reported to ensure that the data clearly reflects current trends. The median pre-money valuation is calculated based on the pre-money valuation given at the time of the initial closing of the round. If the issuer has a closing in a subsequent quarter, the original pre-money valuation is used in the calculation of the median for that quarter as well. A substantial percentage of deals have multiple closings that span fiscal quarters. The median amount raised is calculated based on the aggregate amount raised in the reported quarter. The numbers for each quarter of the current year are regularly updated for additional internal deal reports submitted after each quarterly publication. Consequently, numbers and percentages for prior quarters of the current year reported in this issue may vary from those figures published for those quarters in previous publications this year.
[back to top]
Dow Jones VentureSource Ranks WSGR
No. 1 for Q1-Q3 2014 Venture Financings
Dow Jones VentureSource's legal rankings for Q1-Q3 2014 issuer-side venture financing deals placed Wilson Sonsini Goodrich & Rosati ahead of all other firms by the total number of rounds of equity financing raised on behalf of clients. WSGR is credited as legal advisor in 204 rounds of financing, while its nearest competitor advised on 141 rounds of equity financing. According to VentureSource, WSGR ranked first for Q1-Q3 2014 issuer-side U.S. deals in the following industries: business and financial services, clean technology, consumer goods, electronics and computer hardware, energy and utilities, healthcare, industrial goods and materials, information technology, medical devices and equipment, and software. |
For more information on the current venture capital climate, please contact any member of Wilson Sonsini Goodrich & Rosati's entrepreneurial services team. To learn more about WSGR's full suite of services for entrepreneurs and early-stage companies, please visit the Entrepreneurial Services section of wsgr.com.
For more information about this report or if you wish to be included on the email subscription list, please contact Eric Little. There is no subscription fee. |
This communication is provided as a service to our clients and friends and is for informational purposes only. It is not intended to create an attorney-client relationship or constitute an advertisement, a solicitation, or professional advice as to any particular situation..
© 2014 Wilson Sonsini Goodrich & Rosati, Professional
Corporation
Click here for a printable version of The Entrepreneurs Report |