
From the WSGR Database: Financing Trends for Q1 2015
Venture market activity in the first quarter of 2015 suggests that notable shifts in venture financing may be underway. Pre-money valuations were generally quite high; at the same time, the median amount invested declined significantly. This combination of rising valuations and declining amounts raised would appear to signal an excellent market for founders. However, as reported by PitchBook and other sources, the number of venture deals has declined while the average amounts raised have increased, even though median amounts have not. In other words, venture money is shifting to a smaller number of large deals. This shift is discussed in the article by Recursive Capital Managing Member Eric Ver Ploeg below.
Private Company Financing Trends (WSGR Deals)1
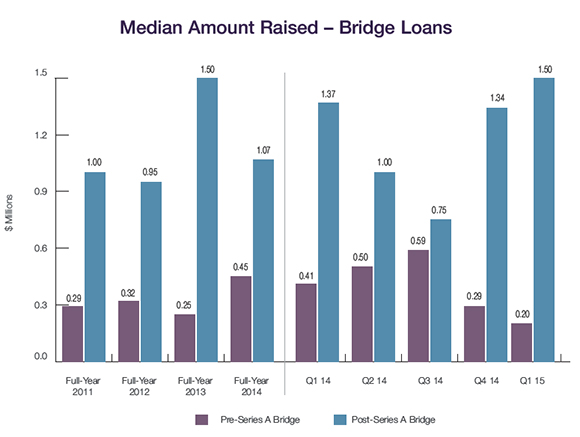
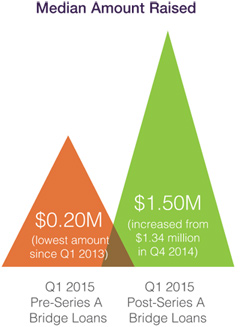
Bridge Loans The Q1 2015 median amount raised in pre-Series A bridge financings was only $0.20 million, the lowest amount since Q1 2013. The equivalent figure for post-Series A loans increased from $1.34 million in Q4 2014 to $1.50 million in Q1 2015. Interest Rates. As has been the case since we started reporting on bridge loans, annual interest rates of less than 8% for pre-Series A loans continued to be the most frequent option, with 89% of such loans in Q1 2015 having rates of less than 8%, up from 72% for full-year 2014. Rates below 8% were the most popular for post-Series A bridge loans as well; they were used in 57% of such deals. Maturities. The percentage of pre-Series A loans having maturities of less than one year increased from 12% in 2014 to 30% in Q1 2015. For post-Series A loans, the percentage of these lower maturities increased from 24% to 43%. This decline in the length of maturities may represent a mutual belief that successful companies will find equity financing relatively quickly.
Trends in Bridge Loans
WSGR's practice is to update the numbers for each quarter of the current year as the year progresses, so figures are subject to change. Methodology for WSGR's Entrepreneurs Report
Price and Preference: Part 2 By Herb Fockler, Partner, Palo Alto This is the second part of a two-part article1 on the importance of whether or not the preferred stock issued to investors in a venture financing participates upon liquidation. The first part discussed the marked shift from participating to non-participating preferred stock in recent years, which we theorized may be a consequence of an increasingly founder-friendly climate, plus possibly increased feeling among Series A investors that choosing non-participating preferred is in their own economic best interest. In this second part, we will explore why that feeling is correct.
As discussed in Part 1, the preferred stock issued in venture financings carries a liquidation preference. This preference provides that upon a liquidation—or, more importantly, an acquisition—of a company, the holders of the preferred stock are first paid an amount per share equal to their original purchase price out of the assets/proceeds available for distribution to equity holders, before any payment is made to the common stockholders. If there are assets/proceeds remaining after the preferred stockholders receive their money back in full, the remainder either can be divided among both the common and preferred stockholders,2 or can be distributed entirely to the common stockholders.3 The first option is referred to as participating preferred, while the second option is referred to as "non-participating preferred." Participating preferred results in investors receiving their investment back, in addition to whatever the common stockholders receive on a per-share basis. Non-participating preferred, on the other hand, forces investors to make a choice—they can receive their investment back as preferred stockholders, or they can elect to convert their preferred to common and receive the same per-share proceeds as the common stockholders. At first glance, it would appear that holders of participating preferred will always receive more than if they held non-participating preferred. The reality, however, is that this is not always true. In fact, where there are multiple rounds of preferred stock, early-stage investors in a rapidly developing company will almost always receive more in an acquisition if the companys preferred stock is non-participating. Thus, the choice between participating and non-participating preferred is an important factor in the economic return to early investors and, given the strong presumption that later rounds of preferred will maintain the general terms of the preceding rounds, this choice is often in the control of the early investors. We start by examining the situation where Series A investors are the only investors in the company. Consider a start-up company where the founders have issued themselves two million shares of common stock. They receive a term sheet for a $2 million Series A Preferred Stock investment at a pre-money valuation of $6 million, resulting in the issuance of 666,667 shares of Series A at a price of $3.00 per share. The pre- and post-deal capitalization table is as follows:
Graph 1 below shows the amounts payable to the Series A and common per share for an acquisition of the company of up to $20 million, when the Series A is participating preferred. All proceeds are allocated to the Series A in deals up to $2 million, and are shared by the Series A and common in the above manner for larger deals. In such case, the Series A always receives more on a per-share basis than the common, regardless of deal size. In contrast, if the Series A Preferred is non-participating, it will entitle its holders to the first $2 million of proceeds to be distributed, or $3.00 per share, but no more than that, no matter how large the deal. To get more than $3.00 per share, and share in the upside of the company, the preferred holders will have to voluntarily convert their preferred stock to common stock, thus forgoing their liquidation preference in order to get the larger return per share that the common is receiving.4 Graph 2 below again shows the amounts payable to the Series A and common per share for an acquisition of the company of up to $20 million, but this time the Series A has no participation rights.
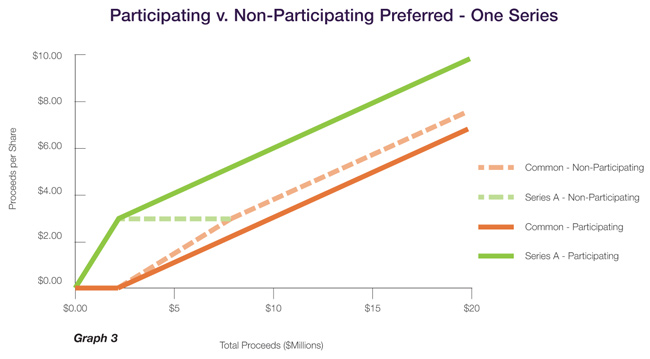
If one compares the two situations by overlaying the two graphs, it becomes obvious that the Series A will always do better with participating preferred when it is the only series.
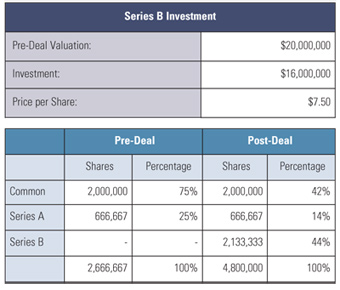
The situation is different if the company takes in later rounds of investment, however. In fact, the circumstances are surprisingly narrow in which the Series A will receive more proceeds in an acquisition of a company with multiple series of participating preferred than one in which all series were non-participating.5 In general, the gain in acquisition proceeds that the Series A realizes over the common from the participating nature of their shares is more than offset by the amount it gives up to the later series of participating preferred.6 Consider the situation where the company in the example above is successful, but still needs to raise additional financing. The company receives a term sheet for a $16 million Series B Preferred Stock investment at a pre-money valuation of $20 million, resulting in the issuance of 2,133,333 shares of Series B at a price of $7.50 per share. The pre- and post-deal capitalization table is as follows:
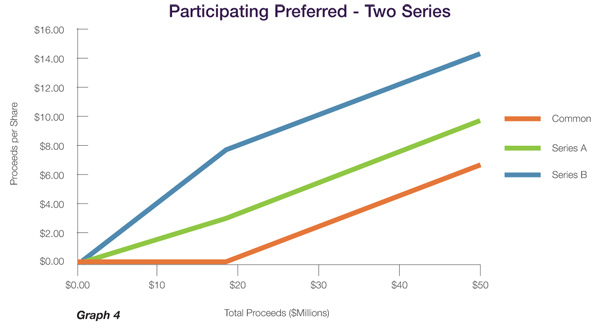
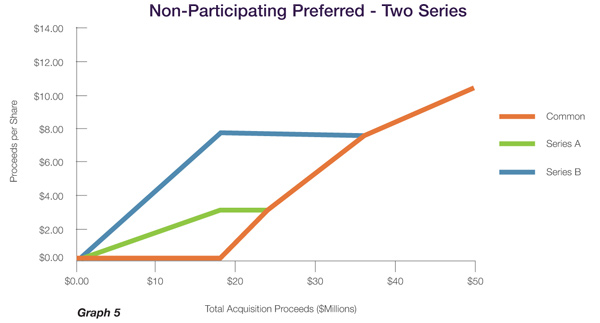
The following graph shows how the proceeds per share of common, Series A, and Series B vary for acquisitions up to $50 million where both series of preferred are participating.7 For deal values less than $18 million—the aggregate amount invested by the Series A and B—the entire proceeds are allocated to the preferred in proportion to the aggregate liquidation preference of each series, with no proceeds going to the common. When the deal value surpasses $18 million, the common begins to receive proceeds, and the Series A and B each receive (in addition to the return of their original purchase price) an amount equal to that received by the common on a per-share basis. As above, the participating nature of the preferred results in each series always receiving more per share than the common.
As shown below, where both series of preferred are non-participating, the entire proceeds are again allocated to the Series A and B, with none to the common, until the deal value reaches $18 million. Once over $18 million, the common is allocated all remaining proceeds, with the result that the Series A voluntarily converts to common at $24 million, and the Series B converts at $36 million. Thus, at deal values of $36 million and above, the holders of common, Series A, and Series B all receive the same amount per share.
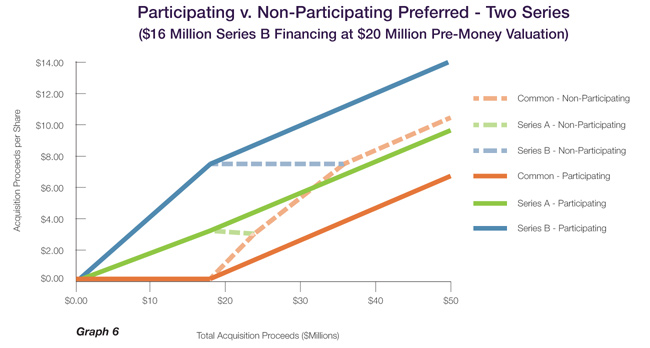
Overlaying the two graphs again shows the effect on proceeds per share for each series of switching from participating to non-participating preferred. The Series B clearly receives less per share, and the common clearly receives more. But in this particular scenario, for deals with proceeds above approximately $32 million, the Series A somewhat surprisingly receives more per share with non-participating preferred.
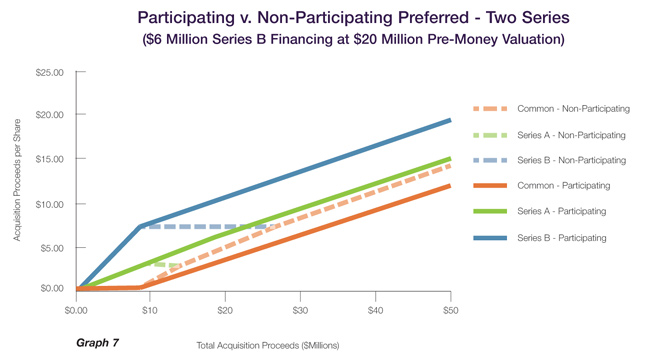
The explanation for this counterintuitive result is that when moving from participating to non-participating preferred, the Series A gives up their own liquidation preference per share, but gains a pro rata share of the aggregate Series B liquidation preference (that is, the total Series B investment amount) that otherwise would have all gone to the Series B under participation. The foregoing is not true in all cases, as there are some situations where the Series A does better with both them and the Series B participating. For example, the following graph shows the comparison between participation and non-participation where the amount raised in the Series B financing was only $6 million, rather than the $16 million above.
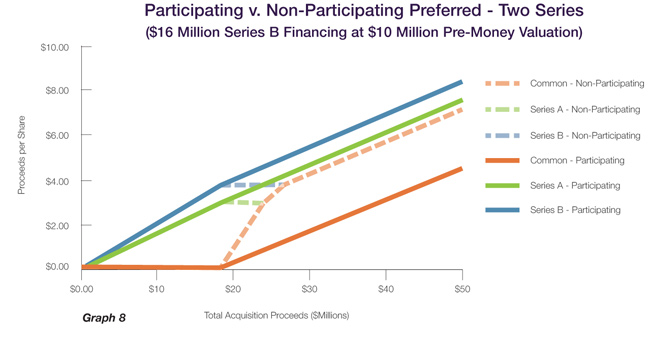
The Series A also does better with both series participating when the amount raised in the Series B financing was the $16 million in the first example, but the pre-money valuation of that financing was only $10 million, rather than $20 million.
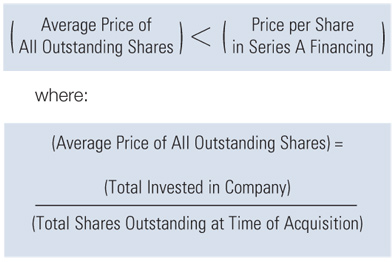
In short, the optimal economic situation for the Series A with respect to participating or non-participating preferred varies with both the amount raised in and the pre-money valuation of the Series B financing. So when should an early-stage investor choose participating over non-participating preferred when proposing terms for a Series A financing? As a general rule, early-stage investors in a company will do better with participating preferred only when the average price paid for all shares outstanding at the time of an acquisition is less than the price they paid per share in their Series A financing. Stated in mathematical terms, when Series A and Series B are participating, the Series A investors will have an equal or higher return at all acquisition prices only if:
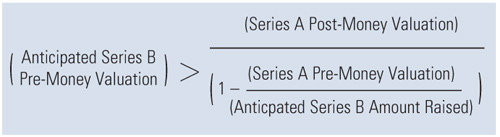
The formula above is fairly simple to apply with hindsight at the time of an acquisition, but that is likely to be long after the Series A investors have had to choose between proposing participating or non-participating preferred. To benefit from it at that earlier time requires first-round investors to estimate not only the total amount of capital that the company will need to raise over its life, but also the total number of shares that the company will issue over multiple financing rounds. The equation can, however, be recast in a form that can assist Series A investors at the time of the first-round financing in ruling out participating preferred, based merely upon estimates of the amount to be raised in the next financing round and the pre-money valuation of that round.8 For a given estimated Series B investment amount, the Series A investors should choose non-participating whenever:
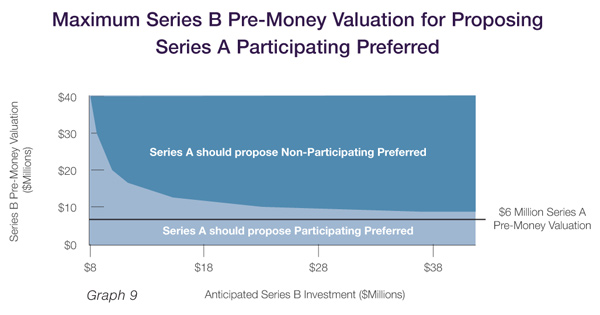
This new equation points to the underlying economics trade-off in moving from participating to non-participating preferred. As stated above, whether the Series A investors will do better or worse with non-participating preferred depends upon whether the amount they lose in giving up their liquidation preference is exceeded by their gaining a pro rata share of the combined liquidation preference of both the Series A and B, spread out over all outstanding Series A, Series B, and common shares. So long as the total amount expected to be distributed to stockholders in an eventual acquisition is more than the combined liquidation preferences of the Series A and B, the answer to this question is independent of the actual amount to be distributed. Instead, it depends only on the estimated amount raised in the Series B financing and the estimated pre-money valuation of that financing. Applying this equation for our hypothetical company above, we can see that if the Series A investors anticipate that the company will need to raise approximately $16 million in a Series B financing, they should propose participating preferred only if they think that the company will not be able to obtain a pre-money valuation in the Series B financing of more than $12.8 million (compared to the Series A post-money valuation of $8 million). More generally, the following graph shows the maximum Series B pre-money valuations for proposing participating preferred for a range of estimated Series B amounts raised. The graph demonstrates that in almost all realistic anticipated Series B scenarios, the Series A will do better with non-participating preferred. Participating preferred will be better only when (a) the anticipated pre-money valuation of the Series B financing is very close to the post-money valuation of the Series A financing, which likely indicates that the company is expected to make little progress between the two rounds, or (b) the anticipated amount to be raised in the Series B financing is not much more than the pre-money valuation of the Series A financing, possibly reflecting an expectation that the company will be very cash-efficient, but more likely that the company is not seen as having sufficient growth possibilities to make good use of more invested capital. In short, for any subsequent financing that an earlier investor would generally hope for—a large financing round (or series of rounds) or a significantly higher pre-money valuation, or preferably both—the choice is clear.
We started this article noting the marked shift from participating to non-participating preferred stock in recent years. Perhaps this shift, along with higher pre-money valuations generally, is merely part of a current trend of more founder-favorable first-round investment terms. But the underlying numbers show that whether Series A investors know it or not when they propose non-participating preferred, doing so is very much in the financial interest of not only the founders, but also of the Series A investors themselves. The derivation of the formulas used above, conceptual explanations, and additional comments may be found at https://www.wsgr.com/PDFs/ER-0515.pdf.
1Part 1 was published in the 1H 2014 issue of The Entrepreneurs Report. Haves and Have Nots in Venture Financings Data from Wilson Sonsini Goodrich & Rosati shows that a small number of companies always command the highest valuations—now and five years ago By Eric Ver Ploeg, Managing Member, Recursive Capital
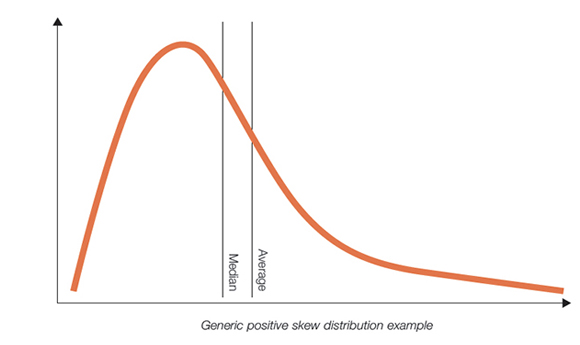
Positive Skew Distribution Since the lowest valuation in a venture financing can't go below zero and the highest valuation is unbounded, we expect the average to be higher than the median. To the right is a graphical reminder of what a positive skew distribution looks like. The ratio of the average value to the median value gives us a measure of how far out those outliers on the right-hand side are. The higher this ratio, the more pronounced the Haves vs. Have Nots separation is. And, if the Haves vs. Have Nots issue was becoming more pronounced over time, we would expect this ratio of average valuation to median valuation to go up over time. Below is a plot of those ratios drawn from the WSGR financings universe. Each point in this plot represents the average pre-money valuation of the financings WSGR was involved in for the given quarter and the given financing sequence, divided by the median pre-money valuation for the same group.
Looking at the data over time, its hard to draw any strong conclusions. We humans are given to seeing trends where there is just statistical noise. The apparent trend of rising Series B dichotomization over the last few quarters may be evidence of an increasing dichotomization between the Haves and the Have Nots, or it may just be statistical noise. The fact that the Series C+ financings dont show this behavior makes it harder to believe there is a truly causal increasing Haves vs. Have Nots effect. Finally, in the table below, we see something that does seem statistically significant for this data set: The Haves vs. Have Nots effect increases with the financing stage sequence, which doesnt seem too surprising. When an Uber is raising Angel money, it is just another intriguing start-up story, and it commands less of a premium relative to all other financings. But, when they are raising a $1.2B Series D, they have the staggering financial metrics to prove they are the hottest company around.
Eric Ver Ploeg is a managing member at Recursive Capital. He previously spent 10 years as a venture investor and five years as the co-founder of two venture-backed start-ups.
This communication is provided as a service to our clients and friends and is for informational purposes only. It is not intended to create an attorney-client relationship or constitute an advertisement, a solicitation, or professional advice as to any particular situation.. © 2015 Wilson Sonsini Goodrich & Rosati, Professional Corporation Click here for a printable version of The Entrepreneurs Report |
|||||||||||||||||||||||||||||||||||||||||||||||||||||||||||||||||||||||||||||||||||||||||||||||||||||||||||||||||||||||||||||||||||||||||||||||||||||||||||||||||||||||||||||||||||||||||||||||||||||||||||||||||||||||||||||||||||||||||||||||||||||||||||||||||||||||||||||||||||||||||||||||||||||||||||||||||||||||||||||||||||||||||||||||||||||||||||||||||||||||||||||||||||||||||||||||||||||||||||||||||||||||||||||||||||||||||||||||||||||||||||||||||||||||||||||||||||||||||||||||||||||||||||||||||||||||||||||||||||||||||||||||||||||||||||||||||||||||||||||||||||||||||||||||||||||||||
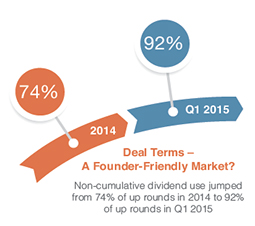 Usage of most deal terms fluctuated by amounts that may be little more than statistical noise. That said, there were at least two trends of note, both of which are consistent with a strong founders’ market: the use of non-cumulative dividends jumped from 74% of up rounds in 2014 to 92% of up rounds in Q1 2015, and the use of non-participating preferred rose to 78% of all deals, up from 74% in 2014, 70% in 2013, and 67% in 2012. These latter figures confirm the trend toward non-participating preferred that we discussed in depth in the article "
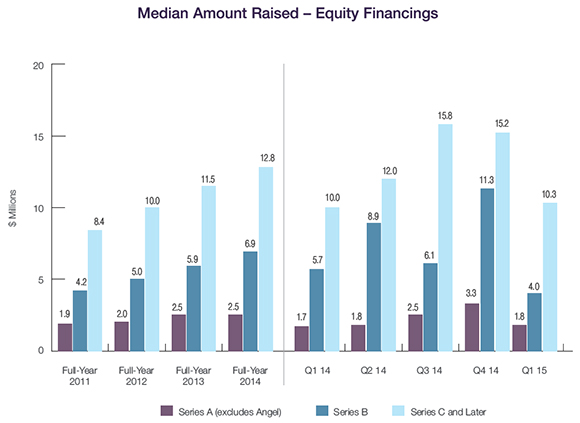

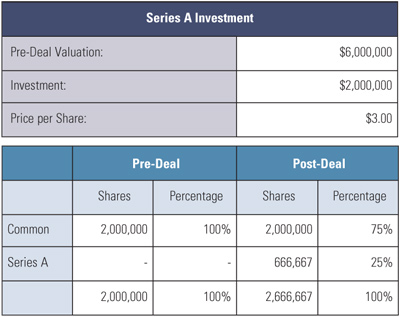 If the Series A Preferred is participating, when the company is sold, the investors will receive the first $2 million of proceeds to be distributed (and all proceeds if they total less than $2 million), and any proceeds over $2 million will be allocated to the Series A and common based upon the number of outstanding shares of each. For example, if the company is sold for $10 million, there will be $8 million remaining after full satisfaction of the Series As liquidation preference. Thus, the common stockholders will receive $3.00 per share of common ($8 million divided by an aggregate of 2,666,667 shares of common and preferred), and the investors will receive $6.00 per share of Series A ($3.00 original purchase price plus the $3.00 the common receives).
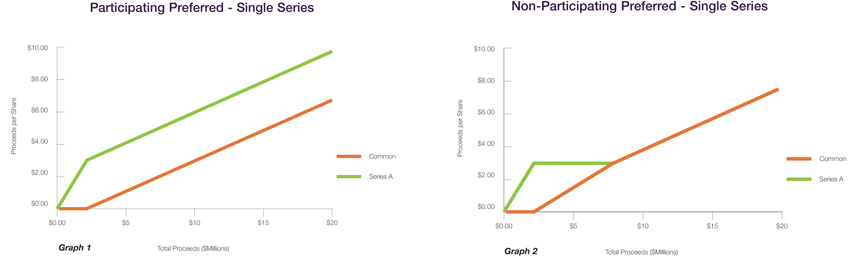
 Various commenters have recently observed that there appears to be a small number of very hot start-ups that can easily raise large amounts of capital at very high valuations, and a larger number of not-as-hot start-ups that face more difficulty in raising money. Representatives from Wilson Sonsini Goodrich & Rosati were kind enough to share some population statistics drawn from their financings database in response to discussions from my previous article ("
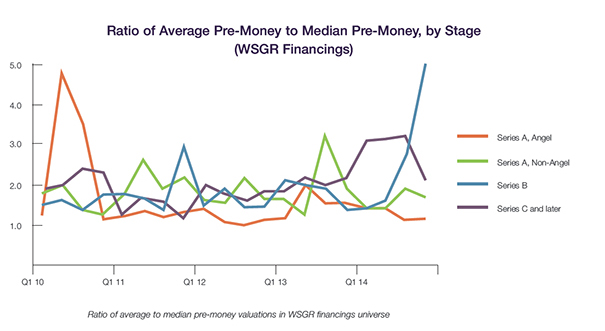 Higher ratio indicates more pronounced positive skew—a few high-value outliers. As expected, we see the ratios are generally well above 1.0. The average ratio across all 80 quarterly data points is about 1.9, which indicates a very pronounced positive skew to the population. This says that venture financings generally have a small number of hot companies commanding very high valuations and a larger number of less-hot companies getting significantly lower valuations.
 In summary, this data leads us to three interesting conclusions: