
From the WSGR Database: Financing Trends for 1H 2013
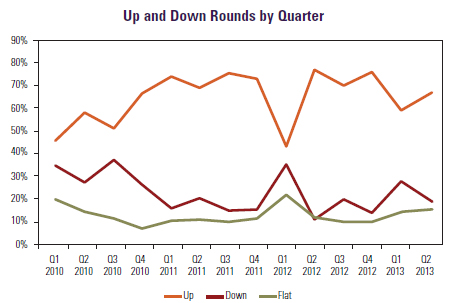
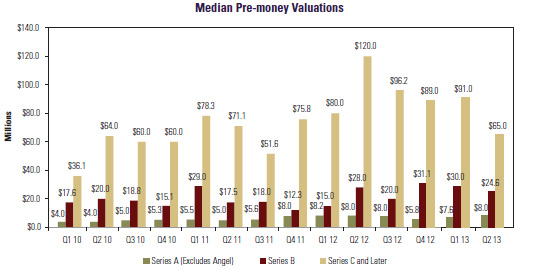
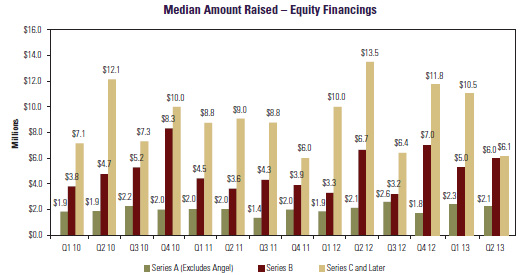
In Q2 2013, up rounds (including several second-stage seed financings) as a percentage of total deals increased modestly compared with Q1 2013. While pre-money valuations remained strong for both venture-led and angel Series A deals that had closings in Q2, valuations of companies doing Series B and later rounds declined significantly. Median amounts raised increased modestly for angel-backed Series A deals but fell for venture-backed companies, while amounts raised increased for Series B deals, but fell for Series C and later rounds. Deal terms remained broadly similar in 1H 2013 as compared with 2012, with a couple of notable exceptions. First, the use of uncapped participation rights in both up and down rounds continued to decline. Second, down rounds also saw a shift away from the use of senior liquidation preferences.
Deal Terms Liquidation preferences. Deals with senior liquidation preferences increased slightly, from 37% of all rounds in 2012 to 38% in 1H 2013. For up rounds, the increase in the use of senior liquidation preferences was stronger, climbing from 30% in 2012 to 36% in 1H 2013. In down rounds, the use of such preferences declined from 56% in 2012 to 39% in 1H 2013. This decline was partially offset by a large rise in the use of complex preference structures in down rounds, from 0% of all deals in 2012 to 11% in 1H 2013. Participation rights. The use of participating preferred decreased from 33% of all deals in 2012 to 28% in 1H 2013. The use of such rights in up rounds decreased substantially, from 33% of all deals in 2012 to 16% in 1H 2013, while for down rounds, the decrease in the use of participating preferred was smaller, from 58% of all deals in 2012 to 55% in 1H 2013. Dividends. The use of cumulative dividends grew slightly, from 9% of all deals in 2012 to 13% in 1H 2013. Anti-dilution provisions. There was a small increase in the use of broad-based weighted-average anti-dilution provisions, from 92% of all rounds in 2012 to 94% in 1H 2013. Pay-to-play provisions. The use of pay-to-play provisions remained level in 1H 2013 as compared with 2012, at 8% of all deals. Redemption. The overall use of redemption provisions declined slightly, from 23% of deals in 2012 to 22% in 1H 2013. In up rounds, the use of investor-option redemption in deals increased slightly, from 23% in 2012 to 24% in 1H 2013, while its use in down rounds declined from 35% to 32% over the same period. To see how the terms tracked in the table below can be used in the context of a financing, we encourage you to draft a term sheet using our automated Term Sheet Generator. You’ll find a link in the Entrepreneurial Services section of wsgr.com, along with information about the wide variety of services that Wilson Sonsini Goodrich & Rosati offers to entrepreneurs and early-stage companies.
Private Company Financing Trends (WSGR Deals)1
Bridge Loans
Interest Rates. Data for 1H 2013 confirmed the previously reported trend of generally declining interest rates for pre-Series A bridge loans but generally increasing interest rates for post-Series A bridge loans. The percentage of pre-Series A bridges with annual rates under 8% increased markedly, from 64% of all deals in 2012 to 75% in 1H 2013. By contrast, the percentage of post-Series A bridge loans with annual interest rates above 8% increased from 15% of all deals in 2012 to 20% in 1H 2013. The percentage of post-Series A bridges with rates of less than 8% declined from 44% to 39%. Maturities. Maturities for pre-Series A bridge loans remain substantially longer than for post-Series A ones. The percentage of pre-Series A deals with maturities of 12 months or more increased from 92% in 2012 to 97% in 1H 2013. For post-Series A loans, maturities of one year or more increased from 66% of loans in 2012 to 69% in 1H 2013. Subordinated Debt. The use of subordinated debt increased between 2012 and 1H 2013 for both pre- and post-Series A bridge loans, rising from 13% of pre-Series A loans in 2012 to 25% in 1H 2013, and from 39% of post-Series A loans in 2012 to 52% in 1H 2013. Warrants. Only a small percentage of pre-Series A loans have warrants, so we did not examine trends in warrant coverage for those deals. For post-Series A bridge loans, the use of warrants increased. In 2012, 33% of the deals with warrants had coverage at 25%. This declined to 10% in 1H 2013, while deals with more than 25% warrant coverage increased from 14% of deals with warrants in 2012 to 48% of such deals in 1H 2013. Conversion. The percentage of pre-Series A bridge loans subject to an explicit price cap on conversion grew from 65% of deals in 2012 to 73% in 1H 2013, and 97% of such deals in 1H 2013 were convertible at a discounted price, up substantially from the 79% figure in 2012. Conversely, the percentage of post-Series A bridge loans subject to a price cap on conversion fell from 24% in 2012 to 13% in 1H 2013, while the percentage of such deals convertible at a discounted price remained roughly constant at 54% of deals in 1H 2013 as compared with 52% in 2012. Multiples. Provision for repayment at a multiple of the loan value in the event of an acquisition increased for pre-Series A loans from 16% of deals in 2012 to 29% in 1H 2013. The percentage of post-Series A loans with such a feature remained constant at 22% for both 2012 and 1H 2013.
Risky Business 2.0: Copyright Law in the Digital Era By Adam Shevell, Associate, Seattle Launching a successful technology start-up comes with a laundry list of risks and pitfalls endemic to any new business venture: luring investors, finding talent, building your big idea. However, technology start-ups face an additional challenge—the very real possibility that new case law might change the effectiveness of their business model overnight. The majority of intellectual property laws were designed to address the issues and competing interests of a bygone analog era. Copyright law, for example, originated in the early 18th century to address the problems raised by the invention of the printing press, which permitted the mass, unregulated copying of books. Yet the printed medium in which the creative work of an author of fiction is expressed differs greatly from that used to disseminate the creative work of a computer programmer. The result is that the application of intellectual property laws to digital technologies can be imperfect. When new technology is launched, questions about how existing intellectual property laws will be applied to that new technology may not be answered for many years, perhaps until there is a judicial resolution of a dispute or clarifying legislation. Though the legal and business communities may reach consensus as to how existing doctrines should be applied to new situations, there always is a risk that courts ultimately will decide differently—and long after the industry has allocated its resources accordingly. Two recent cases in the area of copyright law highlight the fact that technology companies can face unexpected losses (or opportunities) because of rulings in copyright, patent, or trademark litigation. Reselling Previously Purchased Products ReDigi, Inc., a Cambridge, Massachusetts-based company, created an online platform that permits users to upload copies of music that they had legally purchased from online stores (such as iTunes) for resale. Their technology assured that the music no longer would be available on the computer of the seller. Their business model was designed to take advantage of the "first-sale doctrine" of U.S. copyright law, which permits the purchaser of a legal copy of a copyrighted work (e.g., a compact disc or book) to resell that copy without the permission of the copyright holder. In hindsight, however, it appears as though ReDigi's assumption that the first-sale doctrine would apply equally to copyrighted digital assets may have been in error. In March 2013, a judge for the Southern District of New York ruled that ReDigi's business infringed the copyrights held by Capitol Records.1 The judge in the case found that the analogy to CDs and books relied on by ReDigi was faulty (unless, of course, a user transfers the physical hard drive on which the user's digital files are stored). Because ReDigi's activities were not covered by the first-sale doctrine, the company was held liable for direct and contributory copyright infringement of Capitol Records' copyrights. If the ruling stands on appeal, it may spell the end of ReDigi's digital marketplace. Structure, Sequence, and Organization Oracle also may be a victim of faulty analogies regarding the impact of copyright law on new technology. As a general matter, the owner of the copyright in a software program can limit third parties' rights with respect to that software program. But what part of the software program is actually protected by copyright? Google copied the structure, sequence, and organization of 37 of the 166 Java application programming interfaces (APIs) owned by Oracle when developing its Android operating system. Doing this meant that software developers familiar with the ubiquitous Java could write applications for Android OS without having to learn a new coding language. This gave Google a significant advantage when it came to enticing third-party developers to create apps that run on Android OS. In a 2012 ruling that could have broad impact on the software industry, a judge for the Northern District of California ruled that these parts of Oracle's software are not protectable by copyright.2 Specifically, the judge said that the "structure, sequence, and organization" of the software—meaning the internal organization of the software's libraries and the names given to their header files—are not protectable under the Copyright Act. Rather, only the code contained within the libraries is protectable as the creative work of the author/programmer. The Take-Aways ReDigi's experience shows us that innovators in the technology sphere can find themselves on the wrong side of the law despite taking reasonable precautions to align with the spirit of the law. Though ReDigi's business model puts it at odds with an industry that has spent millions over the years to put a lid on disruptive innovation, ReDigi was confident that it had addressed all of the concerns and interests protected by the first-sale doctrine when developing its elaborate and secure digital marketplace. Oracle, and perhaps other software developers, expected that the structure, sequence, and organization of the Java libraries would be protectable by copyright law. Without this protection, unless Oracle has applicable patent rights, the company cannot stop third parties from copying the structure of the Java libraries so long as they write their own code to implement the libraries' functionality. While, obviously, Oracle and Google are no longer start-ups, the case shows that even the largest and most sophisticated of technology companies can be exposed to these risks. Copyright law took many decades of development to sufficiently address the issues occasioned by the advent of the printing press. Start-ups today—as the incubators of new ideas—are inevitably part of a dynamic process of updating copyright law to handle the issues posed by digital-era technologies. Though it's impossible for a company to fully hedge the risk that these developments will adversely impact its business, identifying analogous scenarios involving analog media (for which copyright law is better settled) can help start-ups successfully navigate these issues. Staying informed of developments in intellectual property law and understanding the gray areas in the law can further help inform a winning strategy. 1 Capitol Records, LLC v. ReDigi, Inc.
This communication is provided for your information only and is not intended to constitute professional advice as to any particular situation. Please note that the opinions expressed in this newsletter are the authors' and do not necessarily reflect the views of the firm or other Wilson Sonsini Goodrich & Rosati attorneys. © 2013 Wilson Sonsini Goodrich & Rosati, Professional Corporation Click here for a printable version of The Entrepreneurs Report |
|||||||||||||||||||||||||||||||||||||||||||||||||||||||||||||||||||||||||||||||||||||||||||||||||||||||||||||||||||||||||||||||||||||||||||||||||||||||||||||||||||||||||||||||||||||||||||||||||||||||||||||||||||||||||||||||||||||||||||||||||||||||||||||||||||||||||||||||||||||||||||||||||||||||||||||||||||||||||||||||||||||||||||||||||||||||||||||||||||||||||||||||||||||||||||||||||||||||||||||||||||||||||||||
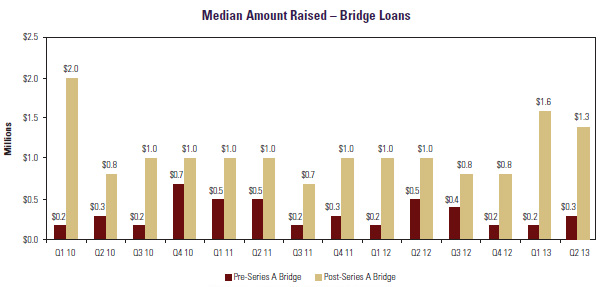 The median amount raised in pre-Series A bridge financings increased from Q1 2013 to Q2 2013 but declined in post-Series A loans. The median pre-Series A loan amount rose from $200K in Q1 2013 to $300K in Q2 2013, while the median for post-Series A loans dropped from $1.6M in Q1 2013 to $1.3M in Q2 2013.