From the WSGR Database: Financing Trends for Q2 2012 and 1H 2012
For purposes of the statistics and
charts in this report, our database
includes venture financing
transactions in which Wilson
Sonsini Goodrich & Rosati
represented either the company or
one or more of the investors. We do
not include venture debt or venture
leasing transactions.
|
Despite some uncertainty in the capital markets, overall venture investment activity remains strong, particularly in the software, IT, and Internet spaces. In addition, we are seeing more early-stage activity, especially in those sectors. Indeed, our quarterly survey of venture-funding transactions supports these observations and indicates a continued improvement in certain key metrics. For instance, the percentage of venture-funding transactions representing up rounds during the second quarter of 2012 increased significantly over those in the first quarter, to levels that are comparable to the last two quarters of 2011. In addition, the median valuations for post-Series A funding rounds during the second quarter increased sharply compared with the median valuations during the first quarter. These results indicate that the venture-funding environment continues to improve for entrepreneurs and venture-funded companies.
Moreover, our survey of the terms of the venture-funding rounds closed during the first half of 2012 echoes this trend. The percentage of deals during the first half of this year where senior liquidation preferences were used is lower compared with 2011 and 2010. Similarly, the percentage of deals with non-participating preferred stock increased during the first half of 2012 compared with 2011 and 2010.
Therefore, while there are some conflicting reports from other sources as to the trends in the overall number of deals and dollars invested during the second quarter, we believe that the valuations and deal terms indicate an overall healthy venture-funding environment.
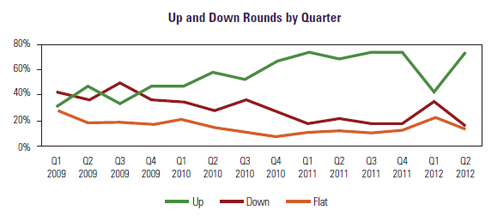
Up and Down Rounds
The substantial majority of financings in Q2 2012 were up rounds, which comprised roughly 75% of all deals. While this percentage represents a large increase from Q1 2012, when up rounds represented only 42% of financings, it is nearly identical to the comparable figures from Q4 2011 (73%) and Q3 2011 (75%). Down rounds and flat rounds also reverted to the comparable figures from Q3 and Q4 2011. Specifically, down rounds comprised 13% of all financings, significantly down from 36% of deals in Q1 but similar to the 15% figures for each of Q3 2011 and Q4 2011. Similarly, flat rounds decreased to 13% of Q2 2012 deals, down from 22% in Q1 but similar to the 10% and 12% figures in Q3 2011 and Q4 2011, respectively. |
 |
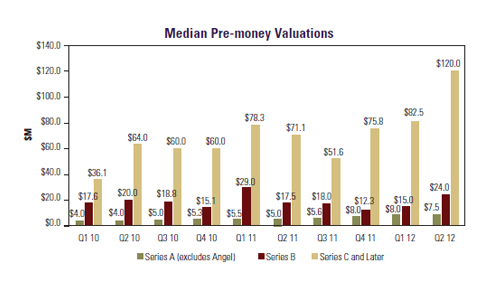 |
Valuations
Companies that received their first round of venture financing in Q2 2012 did so at valuations slightly lower than the prior two quarters. The median pre-money valuation for Q2 2012 Series A rounds (other than angel deals) was $7.5 million, compared with $8.0 million in each of Q1 2012 and Q4 2011.
Q2 valuations for more established companies, however, were much higher than those in the prior two quarters. The median pre-money valuation for Series B deals increased markedly to $24.0 million in Q2 2012, up from $15.0 million in Q1 2012 and $12.3 million in Q4 2011. The proportional increase was nearly as large for companies raising funds in Series C and later rounds, where the median pre-money valuation rose to $120.0 million in Q2 2012 from $82.5 million in Q1 2012 and $75.8 million in Q4 2011. |
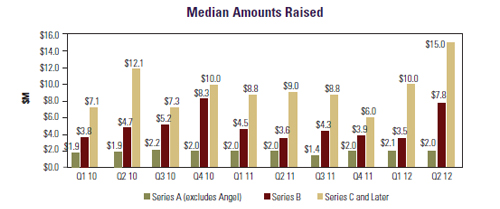
Amounts Raised
Median amounts raised in Q2 2012 as compared with the prior two quarters were flat for initial rounds of financing but increased markedly for later rounds. For non-angel Series A rounds, the median amount raised was $2.0 million, nearly identical to the $2.1 million and $2.0 million figures for closings in Q1 2012 and Q4 2011, respectively. For Series B rounds, the median amount raised was $7.8 million, more than twice the $3.5 million and $3.9 million figures for Q1 2012 and Q4 2011, respectively. Similarly, the median amount raised for Series C rounds was $15.0 million, a significant increase from the $10.0 million figure for Q1 2012 and the $6.0 million figure for Q4 2011. |
 |
Deal Terms:
Liquidation preferences. Senior liquidation preferences were used in 38% of all deals in 1H 2012, down from 47% of deals in 2011 and 50% in 2010. The use of such preferences decreased both in up rounds, from 34% in 2011 to 23% in 1H 2012, and down rounds, from 79% in 2011 to 63% in 1H 2012. Conversely, the use of pari passu liquidation preferences increased from 48% of 2010 financings and 51% of 2011 financings to 58% in 1H 2012, and the percentage increased both for up rounds (64% in 2011 to 73% in 1H 2012) and down rounds (18% in 2011 to 33% in 1H 2012). These trends likely reflect the increasing valuations in later-stage rounds and the corresponding greater negotiating power of earlier investors.
Participation rights. The proportion of deals with non-participating preferred stock continued to increase in 1H 2012, from 49% in 2010 and 58% in 2011 to 66% in 1H 2012. The proportion increased both in up rounds, from 59% in 2011 to 72% in 1H 2012, and down rounds, from 32% in 2011 to 36% in 1H 2012. Among participating preferred stock deals, the percentage of deals with no-cap participating preferred stock decreased from 26% in 2011 to 20% in 1H 2012, and the percentage with capped participating decreased from 16% in 2011 to 14% in 1H 2012. Again, these trends likely reflect the increasing valuations in later-stage rounds and the corresponding greater negotiating power of companies and earlier investors.
Anti-dilution provisions. Broad-based weighted-average anti-dilution continued to be overwhelmingly prevalent, being used in 90% of 1H 2012 deals versus 91% of deals in each of 2010 and 2011. Broad-based weighted-average was used in 93% of 1H 2012 up rounds, as compared with 91% of such rounds in 2011, and in 83% of 1H 2012 down rounds, as compared with 80% in 2011. Notably, the use of narrow-based weighted-average anti-dilution fell by half, from 4% of 2011 deals to 2% of those in 1H 2012. The use of ratchet anti-dilution stayed level at 3% of financings in each of 1H 2012 and 2011.
Pay-to-play provisions. The use of pay-to-play provisions decreased from 12% of 2011 deals to 9% of those in 1H 2012. Pay-to-play usage was roughly level in up rounds, at 4% of 1H 2012 financings versus 5% of 2011 financings, but decreased markedly in down rounds, from 31% of 2011 deals to 17% of 1H 2012 deals.
Redemption. The use of redemption provisions dropped slightly, from 24% of deals in 2011 to 22% in 1H 2012. Investor-option redemption (used in 20% of deals) continued to be far more popular than mandatory redemption (2%).
To see how the terms tracked in the table on page 4 might be used in the context of a financing, we encourage you to draft a term sheet using our automated Term Sheet Generator. You’ll find a link in the Entrepreneurial Services section of wsgr.com, along with information about the wide variety of services Wilson Sonsini Goodrich & Rosati offers to entrepreneurs and early-stage companies.
Private Company Financing Trends
(WSGR Deals)1
| |
|
|
|
|
|
|
|
|
|
|
|
|
|
|
|
|
|
|
Liquidation Preferences - Series B and Later |
Senior |
|
|
|
|
|
|
|
|
|
Pari Passu with Other Preferred |
|
|
|
|
|
|
|
|
|
Complex |
|
|
|
|
|
|
|
|
|
Not Applicable |
|
|
|
|
|
|
|
|
|
Participating vs. Non-Participating |
Participating - Cap |
|
|
|
|
|
|
|
|
|
Participating - No Cap |
|
|
|
|
|
|
|
|
|
Non-participating |
|
|
|
|
|
|
|
|
|
Anti-dilution Provisions |
Weighted Average - Broad |
|
|
|
|
|
|
|
|
|
Weighted Average - Narrow |
|
|
|
|
|
|
|
|
|
Ratchet |
|
|
|
|
|
|
|
|
|
Other (Including Blend) |
|
|
|
|
|
|
|
|
|
Pay to Play - Series B and Later |
Applicable to This Financing |
|
|
|
|
|
|
|
|
|
Applicable to Future Financings |
|
|
|
|
|
|
|
|
|
None |
|
|
|
|
|
|
|
|
|
Redemption |
Investor Option |
|
|
|
|
|
|
|
|
|
Mandatory |
|
|
|
|
|
|
|
|
|
None |
|
|
|
|
|
|
|
|
|
| 1We based this analysis on deals having an initial closing in the period to ensure that the data clearly reflects current trends. Please note the numbers do not always add up to 100% due to rounding. |
| 2Includes flat rounds and, unless otherwise indicated, Series A rounds. |
| 3Note that the All Rounds metrics include flat rounds and, in certain cases Series A financings as well. Consequently, metrics in the All Rounds column may be outside the ranges bounded by the Up Rounds and Down
Rounds columns, which will not include such transactions. |
| |
[back to top]
Dow Jones VentureSource Ranks WSGR No. 1 in
1H 2012 Issuer-Side Venture Financing
Dow Jones VentureSource's legal rankings for issuer-side venture equity financing deals in
the first half of 2012 placed Wilson Sonsini Goodrich & Rosati ahead of all other firms by the
total number of rounds of equity financing raised on behalf of clients. The firm is credited as
legal advisor in 157 rounds of financing, while its nearest competitor advised on 86 rounds
of financing.1
According to Dow Jones VentureSource, WSGR ranked first nationally for 1H 2012 issuerside
deals in the following industries: information technology,2 healthcare,3 clean technology,
communications and networking, energy and utilities, consumer goods, consumer services,
industrial goods and materials, business and financial services, semiconductors (tie),
electronics and computer hardware, software, and medical devices and equipment.
1As VentureSource continues to collect data and update its database, newly reported deals from a given time period may alter
these results.
2 Information technology includes the following sub-sectors: semiconductors, communications/networking, electronics/computer
hardware, and software.
3 Healthcare consists of the biopharmaceutical and medical devices/equipment sub-sectors.
|
For more information on the current venture capital climate, please contact any member of Wilson Sonsini Goodrich & Rosati's entrepreneurial services team. To learn more about WSGR's full suite of services for entrepreneurs and early-stage companies, please visit the Entrepreneurial Services section of wsgr.com.
For more information about this report or if you wish to be included on the email subscription list, please contact Eric Little. There is no subscription fee. |
This communication is provided for your information only and is not intended to constitute professional advice as to any particular situation. Please note that the opinions expressed in this newsletter are the authors' and do not necessarily reflect the views of the firm or other Wilson Sonsini Goodrich & Rosati attorneys.
© 2012 Wilson Sonsini Goodrich & Rosati, Professional
Corporation
Click here for a printable version of The Entrepreneurs Report |